29 Ashbrook Rd Exeter, NH 03833
Estimated Value: $545,000 - $694,000
About This Home
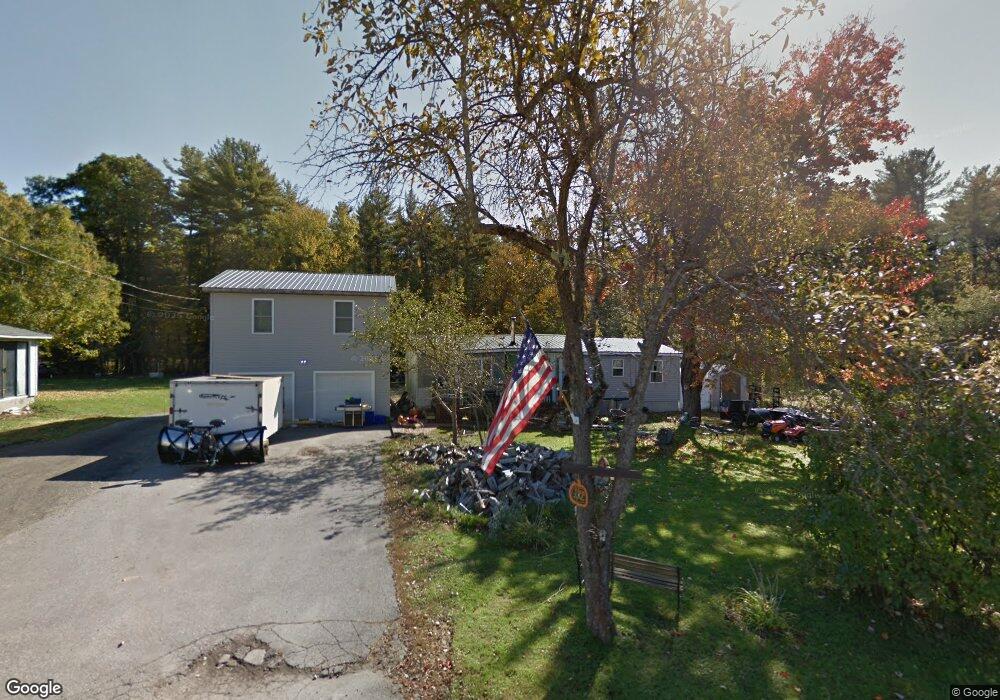
This home is located at 29 Ashbrook Rd, Exeter, NH 03833 and is currently estimated at $630,764, approximately $547 per square foot. 29 Ashbrook Rd is a home with nearby schools including Main Street School, Lincoln Street Elementary School, and Cooperative Middle School.
Ownership History
We collect this data history from publicly available records. To have your information removed, we recommend requesting removal directly through your county’s website.
Purchase Details
Home Financials for this Owner
Home Financials are based on the most recent Mortgage that was taken out on this home.Home Values in the Area
Average Home Value in this Area
Purchase History
We collect this data history from publicly available records. To have your information removed, we recommend requesting removal directly through your county’s website.
| Date | Buyer | Sale Price | Title Company |
|---|---|---|---|
| $108,000 | -- | ||
| $108,000 | -- |
Mortgage History
We collect this data history from publicly available records. To have your information removed, we recommend requesting removal directly through your county’s website.
| Date | Status | Borrower | Loan Amount |
|---|---|---|---|
| Open | $104,760 | ||
| Closed | $104,760 |
Tax History
We collect this data history from publicly available records. To have your information removed, we recommend requesting removal directly through your county’s website.
| Year | Tax Paid | Tax Assessment Tax Assessment Total Assessment is a certain percentage of the fair market value that is determined by local assessors to be the total taxable value of land and additions on the property. | Land | Improvement |
|---|---|---|---|---|
| 2025 | $10,716 | $571,200 | $282,800 | $288,400 |
| 2024 | $10,183 | $572,400 | $282,800 | $289,600 |
| 2023 | $6,682 | $249,500 | $168,300 | $81,200 |
| 2022 | $6,175 | $249,500 | $168,300 | $81,200 |
| 2021 | $5,347 | $222,700 | $151,100 | $71,600 |
| 2020 | $4,986 | $222,700 | $151,100 | $71,600 |
| 2019 | $5,182 | $222,700 | $151,100 | $71,600 |
| 2018 | $1,669 | $185,700 | $111,100 | $74,600 |
| 2017 | $4,741 | $185,700 | $111,100 | $74,600 |
| 2016 | $4,873 | $185,700 | $111,100 | $74,600 |
| 2015 | $4,743 | $185,700 | $111,100 | $74,600 |
| 2014 | $4,289 | $164,600 | $111,200 | $53,400 |
| 2013 | $4,285 | $164,600 | $111,200 | $53,400 |
| 2011 | $4,161 | $164,600 | $111,200 | $53,400 |
Map
- 18 2nd St
- 801 Nottingham Dr
- 6 Meadowood Dr
- 120 Robinhood Dr
- 143 Robin Hood Dr
- 101 Robinhood Dr
- 14 Phinney Ln
- 35 Exeter Farms Rd
- 216 Sterling Hill Ln Unit 216
- 5 Sterling Hill Ln Unit 546
- 4 Sterling Hill Ln Unit 431
- 4 Sterling Hill Ln Unit 417
- 7 Hampton Rd Unit 2
- 46 Acadia Ln Unit 58
- 30 Gale Rd
- 6 Drury Plains Rd
- 12 Olde Rd
- 10 Thornhill Rd
- 15 Prentiss Way
- 0 High St Unit 2
Ask me questions while you tour the home.