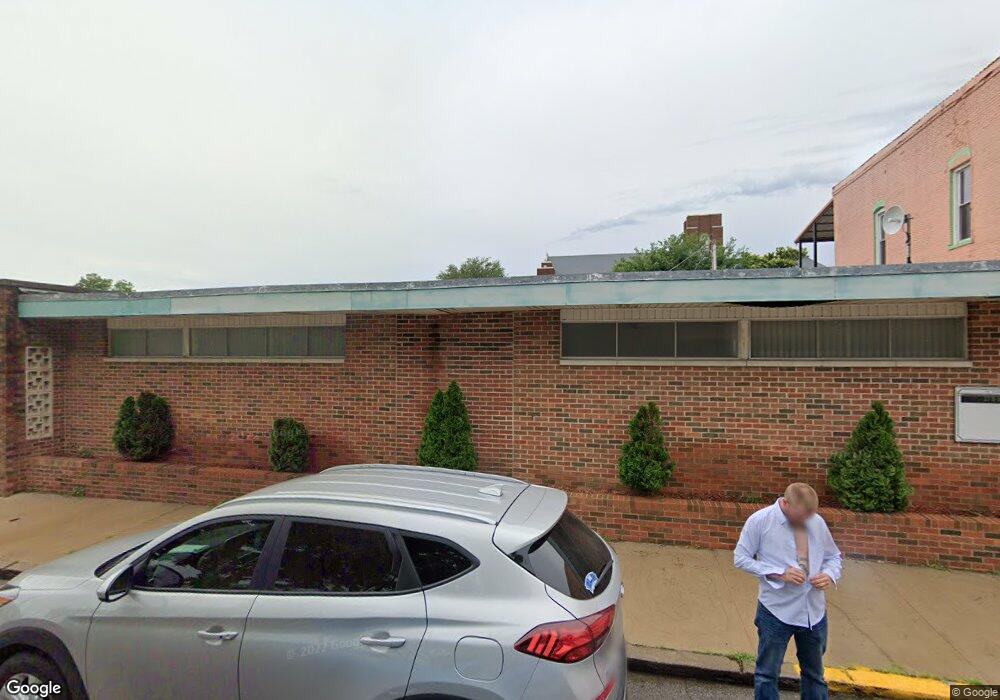
29 B St SW Ardmore, OK 73401
Studio
--
Bath
4,506
Sq Ft
7,841
Sq Ft Lot
About This Home
This home is located at 29 B St SW, Ardmore, OK 73401. 29 B St SW is a home located in Carter County with nearby schools including Lincoln Elementary School, Ardmore Middle School, and Ardmore High School.
Ownership History
Date
Name
Owned For
Owner Type
Purchase Details
Closed on
May 31, 2022
Sold by
Healey Investments Llc
Bought by
Downtown Sushi Llc
Home Financials for this Owner
Home Financials are based on the most recent Mortgage that was taken out on this home.
Original Mortgage
$475,856
Outstanding Balance
$390,562
Interest Rate
4.31%
Mortgage Type
New Conventional
Purchase Details
Closed on
Sep 1, 2006
Sold by
Gunter Marsha Kay and Wagner Vickie Sue
Bought by
Healey Investments Llc
Home Financials for this Owner
Home Financials are based on the most recent Mortgage that was taken out on this home.
Original Mortgage
$190,000
Interest Rate
6.79%
Mortgage Type
Commercial
Create a Home Valuation Report for This Property
The Home Valuation Report is an in-depth analysis detailing your home's value as well as a comparison with similar homes in the area
Purchase History
| Date | Buyer | Sale Price | Title Company |
|---|---|---|---|
| Downtown Sushi Llc | $137,000 | Stewart Title | |
| Healey Investments Llc | $170,000 | -- |
Source: Public Records
Mortgage History
| Date | Status | Borrower | Loan Amount |
|---|---|---|---|
| Open | Downtown Sushi Llc | $475,856 | |
| Previous Owner | Healey Investments Llc | $190,000 |
Source: Public Records
Tax History
| Year | Tax Paid | Tax Assessment Tax Assessment Total Assessment is a certain percentage of the fair market value that is determined by local assessors to be the total taxable value of land and additions on the property. | Land | Improvement |
|---|---|---|---|---|
| 2025 | $1,809 | $18,125 | $6,927 | $11,198 |
| 2024 | $1,705 | $17,262 | $6,598 | $10,664 |
| 2023 | $1,624 | $16,440 | $6,335 | $10,105 |
| 2022 | $2,360 | $24,687 | $9,513 | $15,174 |
| 2021 | $2,742 | $27,181 | $9,513 | $17,668 |
| 2020 | $2,703 | $27,181 | $9,513 | $17,668 |
| 2019 | $2,639 | $27,180 | $9,513 | $17,667 |
| 2018 | $2,783 | $28,188 | $7,356 | $20,832 |
| 2017 | $2,455 | $26,846 | $8,486 | $18,360 |
| 2016 | $2,383 | $25,567 | $2,378 | $23,189 |
| 2015 | $1,871 | $24,350 | $2,378 | $21,972 |
| 2014 | $1,781 | $23,190 | $2,378 | $20,812 |
Source: Public Records
Map
Nearby Homes
Your Personal Tour Guide
Ask me questions while you tour the home.