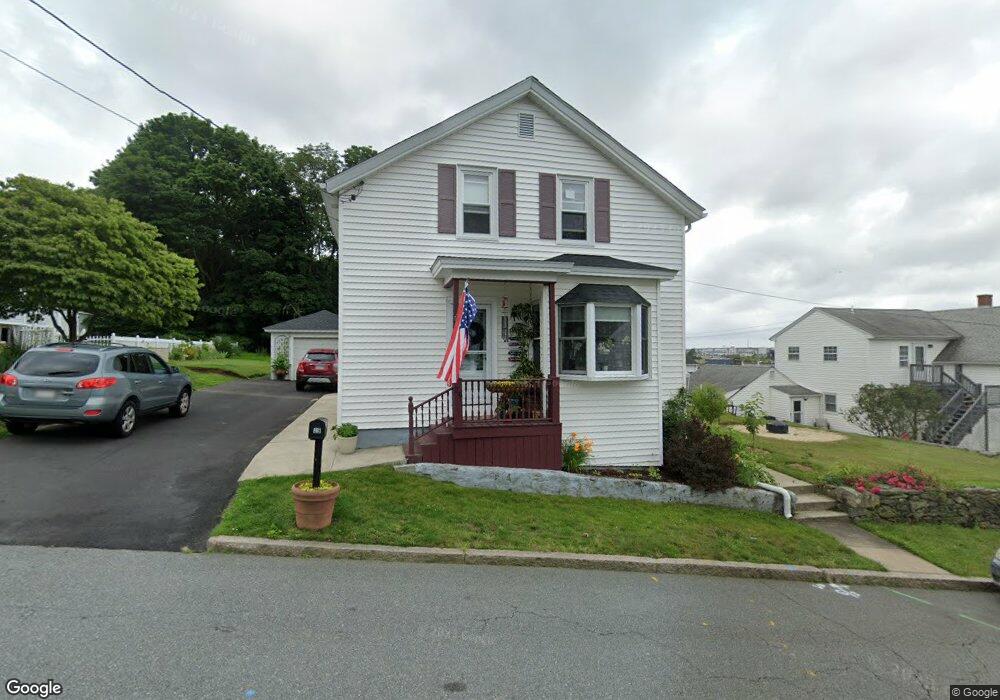
29 Baldwin St Fall River, MA 02720
Western Fall River NeighborhoodEstimated Value: $381,000 - $478,000
4
Beds
2
Baths
1,058
Sq Ft
$389/Sq Ft
Est. Value
About This Home
This home is located at 29 Baldwin St, Fall River, MA 02720 and is currently estimated at $411,742, approximately $389 per square foot. 29 Baldwin St is a home located in Bristol County with nearby schools including North End Elementary School, Morton Middle School, and B M C Durfee High School.
Ownership History
Date
Name
Owned For
Owner Type
Purchase Details
Closed on
Aug 26, 1999
Sold by
Wma Ft
Bought by
Custadio Keith J and Custadio Kathryn A
Current Estimated Value
Home Financials for this Owner
Home Financials are based on the most recent Mortgage that was taken out on this home.
Original Mortgage
$111,150
Interest Rate
7.53%
Mortgage Type
Purchase Money Mortgage
Create a Home Valuation Report for This Property
The Home Valuation Report is an in-depth analysis detailing your home's value as well as a comparison with similar homes in the area
Home Values in the Area
Average Home Value in this Area
Purchase History
| Date | Buyer | Sale Price | Title Company |
|---|---|---|---|
| Custadio Keith J | $117,000 | -- |
Source: Public Records
Mortgage History
| Date | Status | Borrower | Loan Amount |
|---|---|---|---|
| Open | Custadio Keith J | $101,000 | |
| Closed | Custadio Keith J | $111,150 |
Source: Public Records
Tax History
| Year | Tax Paid | Tax Assessment Tax Assessment Total Assessment is a certain percentage of the fair market value that is determined by local assessors to be the total taxable value of land and additions on the property. | Land | Improvement |
|---|---|---|---|---|
| 2025 | $3,571 | $311,900 | $121,600 | $190,300 |
| 2024 | $3,394 | $295,400 | $119,200 | $176,200 |
| 2023 | $3,220 | $262,400 | $107,400 | $155,000 |
| 2022 | $2,809 | $239,600 | $101,300 | $138,300 |
| 2021 | $2,809 | $203,100 | $96,800 | $106,300 |
| 2020 | $2,803 | $194,000 | $92,400 | $101,600 |
| 2019 | $2,805 | $192,400 | $96,500 | $95,900 |
| 2018 | $2,646 | $181,000 | $97,300 | $83,700 |
| 2017 | $2,524 | $180,300 | $97,300 | $83,000 |
| 2016 | $2,444 | $179,300 | $100,200 | $79,100 |
| 2015 | $2,348 | $179,500 | $100,200 | $79,300 |
| 2014 | $2,258 | $179,500 | $100,200 | $79,300 |
Source: Public Records
Map
Nearby Homes
- 33 Warner St
- 257 Calvin St
- 1810 Highland Ave Unit 22
- Parcel 2 Highcrest Rd
- 3636 N Main St Unit 5
- 29 Valentine St
- 210 Harrison Ave
- 2714 Riverside Ave
- 274 Archer St
- 195 Crescent St Unit 3
- 54 Grant Ave
- 1553 Riverside Ave
- 108 Stowe St Unit 108
- 1496 Riverside Ave
- 2106 Meridian St
- 247 Albany St
- 230 College Park Rd
- 201 Montgomery Cir
- 333 Langley St
- 34 Doherty Ave
Your Personal Tour Guide
Ask me questions while you tour the home.