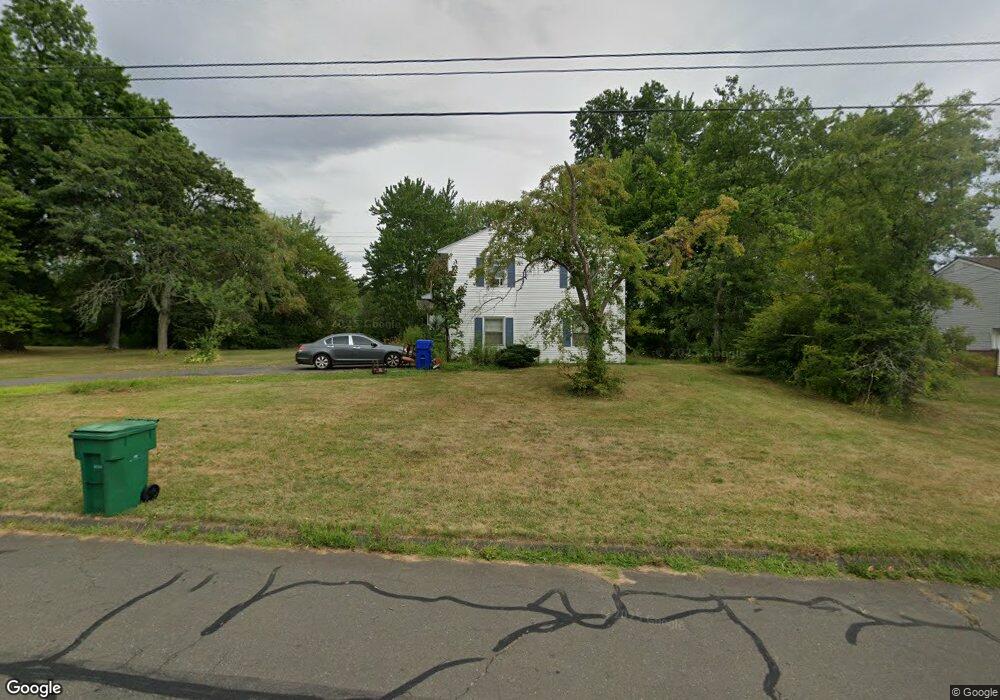
29 Banbury Ln Bloomfield, CT 06002
Estimated Value: $320,000 - $408,000
3
Beds
2
Baths
1,320
Sq Ft
$281/Sq Ft
Est. Value
About This Home
This home is located at 29 Banbury Ln, Bloomfield, CT 06002 and is currently estimated at $371,073, approximately $281 per square foot. 29 Banbury Ln is a home located in Hartford County with nearby schools including Laurel School, Carmen Arace Intermediate School, and Metacomet School.
Ownership History
Date
Name
Owned For
Owner Type
Purchase Details
Closed on
May 27, 2021
Sold by
Stover Karen S
Bought by
Lowe Sean P
Current Estimated Value
Purchase Details
Closed on
Oct 17, 2011
Sold by
Davis Gideon M
Bought by
Davis Karen A
Home Financials for this Owner
Home Financials are based on the most recent Mortgage that was taken out on this home.
Original Mortgage
$159,500
Interest Rate
4.25%
Purchase Details
Closed on
Jun 27, 2008
Sold by
Newman Robin
Bought by
Davis Gideon and Davis Karen
Create a Home Valuation Report for This Property
The Home Valuation Report is an in-depth analysis detailing your home's value as well as a comparison with similar homes in the area
Home Values in the Area
Average Home Value in this Area
Purchase History
| Date | Buyer | Sale Price | Title Company |
|---|---|---|---|
| Lowe Sean P | $210,000 | None Available | |
| Lowe Sean P | $210,000 | None Available | |
| Davis Karen A | -- | -- | |
| Davis Karen A | -- | -- | |
| Davis Gideon | $220,000 | -- | |
| Davis Gideon | $220,000 | -- |
Source: Public Records
Mortgage History
| Date | Status | Borrower | Loan Amount |
|---|---|---|---|
| Previous Owner | Davis Gideon | $189,880 | |
| Previous Owner | Davis Gideon | $159,500 |
Source: Public Records
Tax History Compared to Growth
Tax History
| Year | Tax Paid | Tax Assessment Tax Assessment Total Assessment is a certain percentage of the fair market value that is determined by local assessors to be the total taxable value of land and additions on the property. | Land | Improvement |
|---|---|---|---|---|
| 2025 | $7,030 | $187,460 | $51,520 | $135,940 |
| 2024 | $5,271 | $134,330 | $40,670 | $93,660 |
| 2023 | $5,176 | $134,330 | $40,670 | $93,660 |
| 2022 | $4,840 | $134,330 | $40,670 | $93,660 |
| 2021 | $4,947 | $134,330 | $40,670 | $93,660 |
| 2020 | $4,871 | $134,330 | $40,670 | $93,660 |
| 2019 | $5,153 | $133,280 | $40,670 | $92,610 |
| 2018 | $4,463 | $115,570 | $39,900 | $75,670 |
| 2017 | $4,456 | $115,570 | $39,900 | $75,670 |
| 2016 | $4,351 | $115,570 | $39,900 | $75,670 |
| 2015 | $4,270 | $115,570 | $39,900 | $75,670 |
| 2014 | $4,889 | $136,780 | $51,450 | $85,330 |
Source: Public Records
Map
Nearby Homes
- 2 Lee Cir
- 4 Skinner Dr
- 11 Woodland Ave Unit E
- 12 Filley St
- 14 Filley St
- 79 Prospect St
- 25 Filley St
- 28 Carpenter Ln
- 108 Woodland Ave
- 23 Hawthorne Ln Unit 23
- 70 Tunxis Ave
- 12 Garrison Terrace
- 256 Park Ave
- 159 School St
- 40 Mountain Ave
- 86 Gabb Rd
- 31 Beaman Brook
- 18 Nolan Dr
- 38 Sutton Place Unit 38
- 7 Emerson St