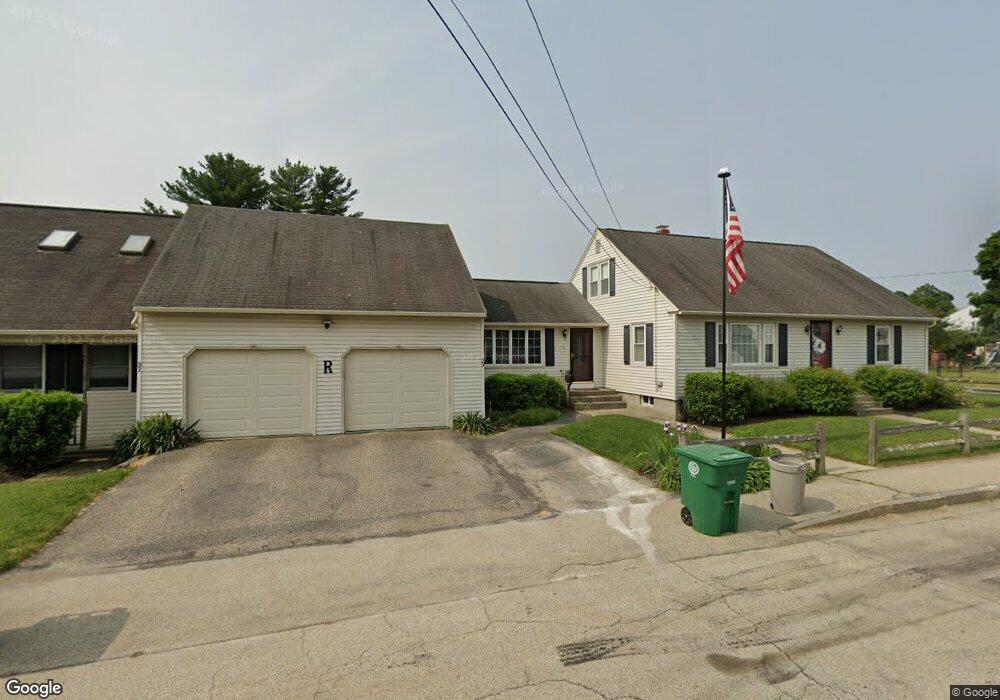
29 Blanchard St Unit 31 Nashua, NH 03060
South End Nashua NeighborhoodEstimated Value: $625,000 - $706,517
6
Beds
2
Baths
3,001
Sq Ft
$218/Sq Ft
Est. Value
About This Home
This home is located at 29 Blanchard St Unit 31, Nashua, NH 03060 and is currently estimated at $653,629, approximately $217 per square foot. 29 Blanchard St Unit 31 is a home located in Hillsborough County with nearby schools including Fairgrounds Elementary School, Fairgrounds Middle School, and Nashua High School South.
Ownership History
Date
Name
Owned For
Owner Type
Purchase Details
Closed on
Aug 8, 2018
Sold by
Rapsis Kenneth G and Rapsis Debra A
Bought by
Rapsis Ft
Current Estimated Value
Purchase Details
Closed on
Jan 28, 1999
Sold by
Pelletier George R and Pelletier Lorraine M
Bought by
Rapsis Debra A and Rapsis Kenneth G
Create a Home Valuation Report for This Property
The Home Valuation Report is an in-depth analysis detailing your home's value as well as a comparison with similar homes in the area
Home Values in the Area
Average Home Value in this Area
Purchase History
| Date | Buyer | Sale Price | Title Company |
|---|---|---|---|
| Rapsis Ft | -- | -- | |
| Rapsis Debra A | $100,000 | -- |
Source: Public Records
Tax History Compared to Growth
Tax History
| Year | Tax Paid | Tax Assessment Tax Assessment Total Assessment is a certain percentage of the fair market value that is determined by local assessors to be the total taxable value of land and additions on the property. | Land | Improvement |
|---|---|---|---|---|
| 2024 | $9,833 | $618,400 | $161,800 | $456,600 |
| 2023 | $9,144 | $501,600 | $129,300 | $372,300 |
| 2022 | $9,064 | $501,600 | $129,300 | $372,300 |
| 2021 | $7,841 | $337,700 | $86,200 | $251,500 |
| 2020 | $7,522 | $332,700 | $86,200 | $246,500 |
| 2019 | $7,240 | $332,700 | $86,200 | $246,500 |
| 2018 | $7,057 | $332,700 | $86,200 | $246,500 |
| 2017 | $8,039 | $311,700 | $93,600 | $218,100 |
| 2016 | $7,814 | $311,700 | $93,600 | $218,100 |
| 2015 | $7,646 | $311,700 | $93,600 | $218,100 |
| 2014 | $7,496 | $311,700 | $93,600 | $218,100 |
Source: Public Records
Map
Nearby Homes
- 22 Kern Dr
- 97 Linwood St
- 63 Dexter St
- 11 Bordeaux St
- 22 New Dunstable Rd Unit 132133
- 41 New Dunstable Rd Unit 371
- 169A W Hollis St Unit 193
- 121 Palm St
- 4 Badger St
- 22 Wilder St
- 15 Lovell St Unit 20
- 15 Lovell St Unit 3
- 15 Lovell St Unit 7
- 15 Lovell St Unit 10
- 30 Ledge St
- 8 Buck St Unit 10
- 29 Greenwood Dr
- 38 Central St
- 6 Hayden St
- 4 Henry David Dr Unit 203
- 6 Edwin St Unit 99
- 25 Blanchard St Unit 95
- 26 Blanchard St
- 13 Cecile St
- 13 Cecile St Unit 15
- 13 Cecile St
- 28 Blanchard St
- 14 Edwin St
- 5 Edwin St Unit 133
- 24 Blanchard St
- 9 Edwin St Unit 92
- 44 Blanchard St
- 22 Blanchard St
- 16 Edwin St Unit 102
- 21 Blanchard St Unit 80
- 9 Cecile St Unit 11
- 14 Caldwell Rd
- 16 Caldwell Rd
- 27 Labine St
- 18 Caldwell Rd