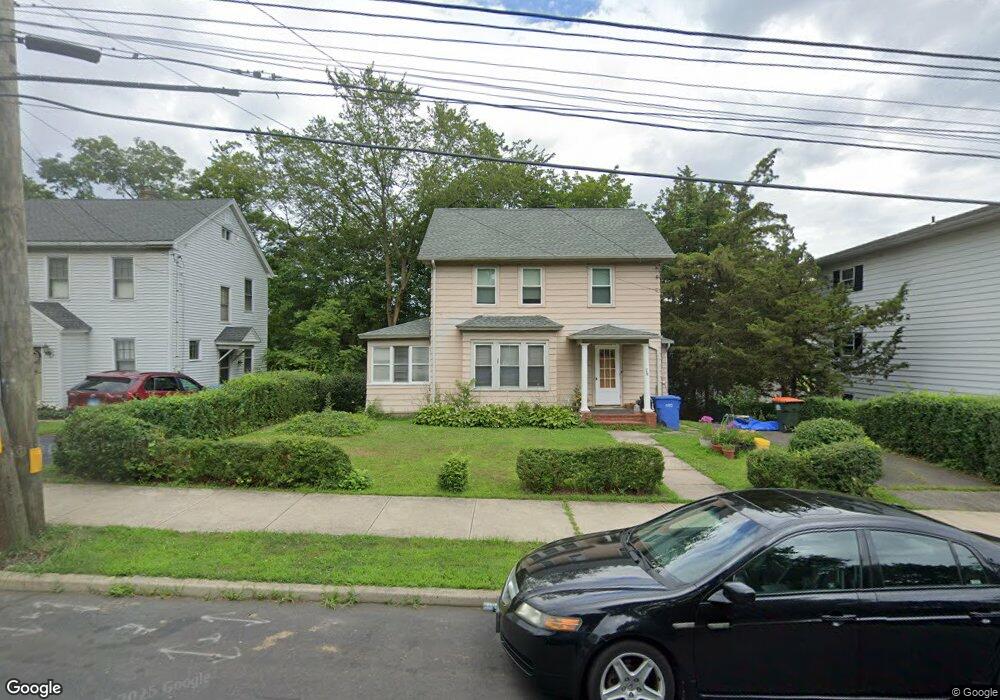
29 Bradley Ave Meriden, CT 06451
South Meriden NeighborhoodEstimated Value: $284,425 - $336,000
2
Beds
2
Baths
1,288
Sq Ft
$233/Sq Ft
Est. Value
About This Home
This home is located at 29 Bradley Ave, Meriden, CT 06451 and is currently estimated at $300,356, approximately $233 per square foot. 29 Bradley Ave is a home located in New Haven County with nearby schools including Benjamin Franklin School, Lincoln Middle School, and Orville H. Platt High School.
Ownership History
Date
Name
Owned For
Owner Type
Purchase Details
Closed on
Sep 8, 2009
Sold by
Lisitano Alan J
Bought by
Lisitano Dellor
Current Estimated Value
Home Financials for this Owner
Home Financials are based on the most recent Mortgage that was taken out on this home.
Original Mortgage
$25,000
Interest Rate
5.31%
Purchase Details
Closed on
Mar 23, 1987
Sold by
Lisitano Del-Lor
Bought by
Lisitano Alan J
Create a Home Valuation Report for This Property
The Home Valuation Report is an in-depth analysis detailing your home's value as well as a comparison with similar homes in the area
Home Values in the Area
Average Home Value in this Area
Purchase History
| Date | Buyer | Sale Price | Title Company |
|---|---|---|---|
| Lisitano Dellor | -- | -- | |
| Lisitano Alan J | $1,000 | -- |
Source: Public Records
Mortgage History
| Date | Status | Borrower | Loan Amount |
|---|---|---|---|
| Closed | Lisitano Alan J | $25,000 |
Source: Public Records
Tax History Compared to Growth
Tax History
| Year | Tax Paid | Tax Assessment Tax Assessment Total Assessment is a certain percentage of the fair market value that is determined by local assessors to be the total taxable value of land and additions on the property. | Land | Improvement |
|---|---|---|---|---|
| 2025 | $4,493 | $118,510 | $43,890 | $74,620 |
| 2024 | $4,564 | $118,510 | $43,890 | $74,620 |
| 2023 | $4,399 | $118,510 | $43,890 | $74,620 |
| 2022 | $3,996 | $114,100 | $43,890 | $70,210 |
| 2021 | $3,501 | $80,430 | $33,250 | $47,180 |
| 2020 | $3,491 | $80,430 | $33,250 | $47,180 |
| 2019 | $3,462 | $80,430 | $33,250 | $47,180 |
| 2018 | $3,475 | $80,430 | $33,250 | $47,180 |
| 2017 | $3,383 | $80,430 | $33,250 | $47,180 |
| 2016 | $3,477 | $89,390 | $29,470 | $59,920 |
| 2015 | $3,477 | $89,670 | $29,750 | $59,920 |
| 2014 | $3,392 | $89,670 | $29,750 | $59,920 |
Source: Public Records
Map
Nearby Homes