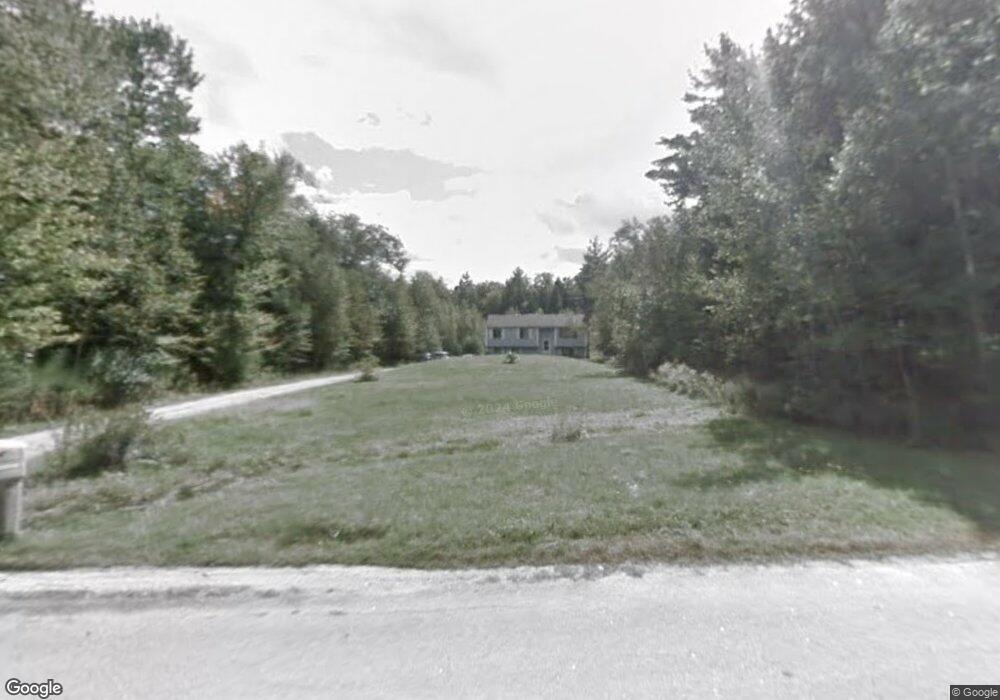
29 Brian Rd Peterborough, NH 03458
Estimated Value: $306,000 - $379,787
3
Beds
1
Bath
1,130
Sq Ft
$310/Sq Ft
Est. Value
About This Home
This home is located at 29 Brian Rd, Peterborough, NH 03458 and is currently estimated at $350,697, approximately $310 per square foot. 29 Brian Rd is a home located in Hillsborough County with nearby schools including Peterborough Elementary School, South Meadow School, and Conval Regional High School.
Ownership History
Date
Name
Owned For
Owner Type
Purchase Details
Closed on
Jan 19, 2024
Sold by
Harris Matthew and Harris Alexis
Bought by
Harris Ft and Harris
Current Estimated Value
Purchase Details
Closed on
Jun 30, 2020
Sold by
Manahan
Bought by
Harris Matthew and Harris Alexis
Home Financials for this Owner
Home Financials are based on the most recent Mortgage that was taken out on this home.
Original Mortgage
$186,868
Interest Rate
3.2%
Mortgage Type
New Conventional
Purchase Details
Closed on
Aug 22, 2014
Sold by
Manahan Ronald F and Manahan Teresa A
Bought by
Ronald and Ronald Teresa Manahan
Purchase Details
Closed on
Mar 11, 2010
Sold by
Deutsche Bk Natl T Co
Bought by
Manahan Ronald and Manahan Teresa
Purchase Details
Closed on
Aug 19, 2009
Sold by
Coleman Paul T and Ameriquest Mtg Securit
Bought by
Ameriquest Mtg Securit
Create a Home Valuation Report for This Property
The Home Valuation Report is an in-depth analysis detailing your home's value as well as a comparison with similar homes in the area
Home Values in the Area
Average Home Value in this Area
Purchase History
| Date | Buyer | Sale Price | Title Company |
|---|---|---|---|
| Harris Ft | -- | None Available | |
| Harris Ft | -- | None Available | |
| Harris Matthew | $185,000 | None Available | |
| Harris Matthew | $185,000 | None Available | |
| Ronald | -- | -- | |
| Manahan Ronald | $110,000 | -- | |
| Ameriquest Mtg Securit | $116,200 | -- |
Source: Public Records
Mortgage History
| Date | Status | Borrower | Loan Amount |
|---|---|---|---|
| Previous Owner | Harris Matthew | $186,868 | |
| Previous Owner | Ameriquest Mtg Securit | $123,200 | |
| Previous Owner | Ameriquest Mtg Securit | $142,500 |
Source: Public Records
Tax History
| Year | Tax Paid | Tax Assessment Tax Assessment Total Assessment is a certain percentage of the fair market value that is determined by local assessors to be the total taxable value of land and additions on the property. | Land | Improvement |
|---|---|---|---|---|
| 2025 | $7,228 | $222,400 | $54,700 | $167,700 |
| 2024 | $7,228 | $222,400 | $54,700 | $167,700 |
| 2023 | $6,269 | $222,400 | $54,700 | $167,700 |
| 2022 | $5,751 | $222,400 | $54,700 | $167,700 |
| 2021 | $5,729 | $222,400 | $54,700 | $167,700 |
| 2020 | $5,564 | $180,400 | $45,600 | $134,800 |
| 2019 | $5,367 | $180,400 | $45,600 | $134,800 |
| 2018 | $5,871 | $195,100 | $51,200 | $143,900 |
| 2017 | $5,034 | $160,000 | $48,200 | $111,800 |
| 2016 | $4,934 | $160,000 | $48,200 | $111,800 |
| 2015 | $4,754 | $160,000 | $48,200 | $111,800 |
| 2014 | $4,740 | $155,100 | $51,100 | $104,000 |
Source: Public Records
Map
Nearby Homes
Your Personal Tour Guide
Ask me questions while you tour the home.