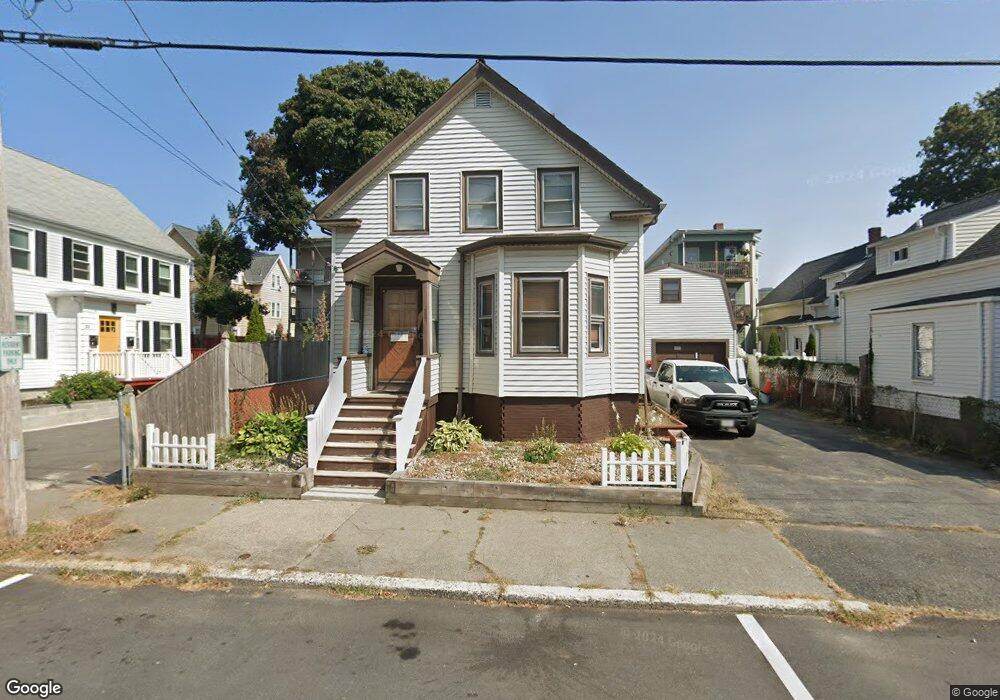
29 Carnes St Lynn, MA 01905
Lower Boston Street NeighborhoodEstimated Value: $488,000 - $544,000
2
Beds
2
Baths
1,362
Sq Ft
$379/Sq Ft
Est. Value
About This Home
This home is located at 29 Carnes St, Lynn, MA 01905 and is currently estimated at $516,328, approximately $379 per square foot. 29 Carnes St is a home located in Essex County with nearby schools including North Park Elementary School, Tracy Elementary School, and William R. Fallon School.
Ownership History
Date
Name
Owned For
Owner Type
Purchase Details
Closed on
Apr 5, 2023
Sold by
Nardone Denise E and Nardone Edward A
Bought by
Nardone Adventure T and Nardone N
Current Estimated Value
Purchase Details
Closed on
Apr 1, 1979
Bought by
Nardone Edward A and Nardone Denise E
Create a Home Valuation Report for This Property
The Home Valuation Report is an in-depth analysis detailing your home's value as well as a comparison with similar homes in the area
Home Values in the Area
Average Home Value in this Area
Purchase History
| Date | Buyer | Sale Price | Title Company |
|---|---|---|---|
| Nardone Adventure T | -- | None Available | |
| Nardone Adventure T | -- | None Available | |
| Nardone Adventure T | -- | None Available | |
| Nardone Adventure T | -- | None Available | |
| Nardone Edward A | $24,500 | -- |
Source: Public Records
Tax History Compared to Growth
Tax History
| Year | Tax Paid | Tax Assessment Tax Assessment Total Assessment is a certain percentage of the fair market value that is determined by local assessors to be the total taxable value of land and additions on the property. | Land | Improvement |
|---|---|---|---|---|
| 2025 | $5,001 | $482,700 | $189,600 | $293,100 |
| 2024 | $4,799 | $455,700 | $178,200 | $277,500 |
| 2023 | $4,642 | $416,300 | $172,700 | $243,600 |
| 2022 | $4,711 | $379,000 | $159,900 | $219,100 |
| 2021 | $4,671 | $358,500 | $153,600 | $204,900 |
| 2020 | $4,348 | $324,500 | $135,300 | $189,200 |
| 2019 | $4,136 | $289,200 | $110,700 | $178,500 |
| 2018 | $3,674 | $242,500 | $92,100 | $150,400 |
| 2017 | $3,407 | $218,400 | $78,100 | $140,300 |
| 2016 | $3,273 | $202,300 | $69,600 | $132,700 |
| 2015 | $3,035 | $181,200 | $64,900 | $116,300 |
Source: Public Records
Map
Nearby Homes