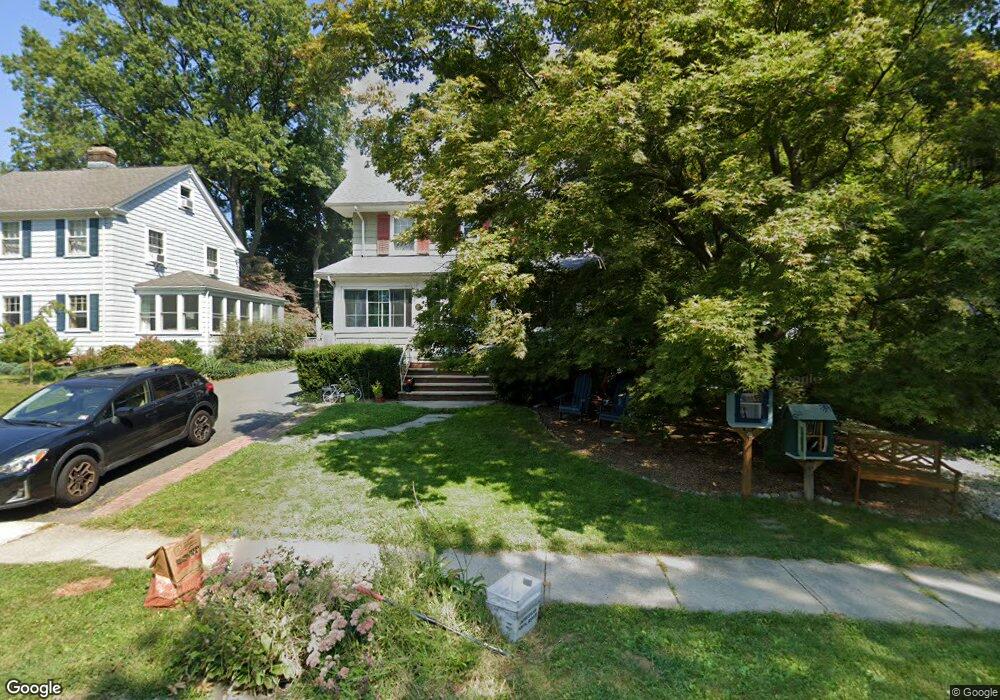
29 Carolin Rd Montclair, NJ 07043
Estimated Value: $1,385,905 - $1,667,000
Studio
--
Bath
2,899
Sq Ft
$546/Sq Ft
Est. Value
About This Home
This home is located at 29 Carolin Rd, Montclair, NJ 07043 and is currently estimated at $1,581,976, approximately $545 per square foot. 29 Carolin Rd is a home located in Essex County with nearby schools including Bradford School, Hillside School, and Nishuane School.
Ownership History
Date
Name
Owned For
Owner Type
Purchase Details
Closed on
Dec 7, 1998
Sold by
Melartin Jussi E
Bought by
Isidore Christopher
Current Estimated Value
Home Financials for this Owner
Home Financials are based on the most recent Mortgage that was taken out on this home.
Original Mortgage
$192,000
Outstanding Balance
$41,239
Interest Rate
6.68%
Estimated Equity
$1,540,737
Purchase Details
Closed on
Jun 19, 1990
Sold by
Massenburg Sharon L
Bought by
Melartin Jussi E and Melartin Lisa B
Purchase Details
Closed on
Jul 14, 1988
Sold by
Slot Sharon L B
Bought by
Walther Audrey
Create a Home Valuation Report for This Property
The Home Valuation Report is an in-depth analysis detailing your home's value as well as a comparison with similar homes in the area
Home Values in the Area
Average Home Value in this Area
Purchase History
| Date | Buyer | Sale Price | Title Company |
|---|---|---|---|
| Isidore Christopher | $240,000 | -- | |
| Melartin Jussi E | $215,000 | -- | |
| Walther Audrey | -- | -- |
Source: Public Records
Mortgage History
| Date | Status | Borrower | Loan Amount |
|---|---|---|---|
| Open | Isidore Christopher | $192,000 |
Source: Public Records
Tax History
| Year | Tax Paid | Tax Assessment Tax Assessment Total Assessment is a certain percentage of the fair market value that is determined by local assessors to be the total taxable value of land and additions on the property. | Land | Improvement |
|---|---|---|---|---|
| 2025 | $25,295 | $743,300 | $367,600 | $375,700 |
| 2024 | $25,124 | $743,300 | $367,600 | $375,700 |
| 2022 | $24,440 | $743,300 | $367,600 | $375,700 |
| 2021 | $24,016 | $743,300 | $367,600 | $375,700 |
| 2020 | $23,630 | $743,300 | $367,600 | $375,700 |
| 2019 | $23,384 | $743,300 | $367,600 | $375,700 |
| 2018 | $22,998 | $743,300 | $367,600 | $375,700 |
| 2017 | $21,056 | $563,900 | $329,400 | $234,500 |
| 2016 | $17,625 | $485,000 | $329,400 | $155,600 |
| 2015 | $17,101 | $485,000 | $329,400 | $155,600 |
| 2014 | $16,529 | $485,000 | $329,400 | $155,600 |
Source: Public Records
Map
Nearby Homes
- 42 Carolin Rd
- 398 Grove St
- 9 Mount Vernon Rd
- 363 Park St
- 386 Park St
- 3 Christopher Ct
- 470 Valley Rd Unit C003A
- 470 Valley Rd Unit 9A
- 14 Northview Ave
- 82 Watchung Ave Unit 84
- 47 Northview Ave
- 166 Montclair Ave
- 26 Clairidge Ct
- 29 Norwood Ave
- 16 Stephen St
- 45 Wells Ct
- 17 Mendl Terrace
- 14 Davidson Rd
- 40 Golf Rd
- 58 Yantecaw Ave
Your Personal Tour Guide
Ask me questions while you tour the home.