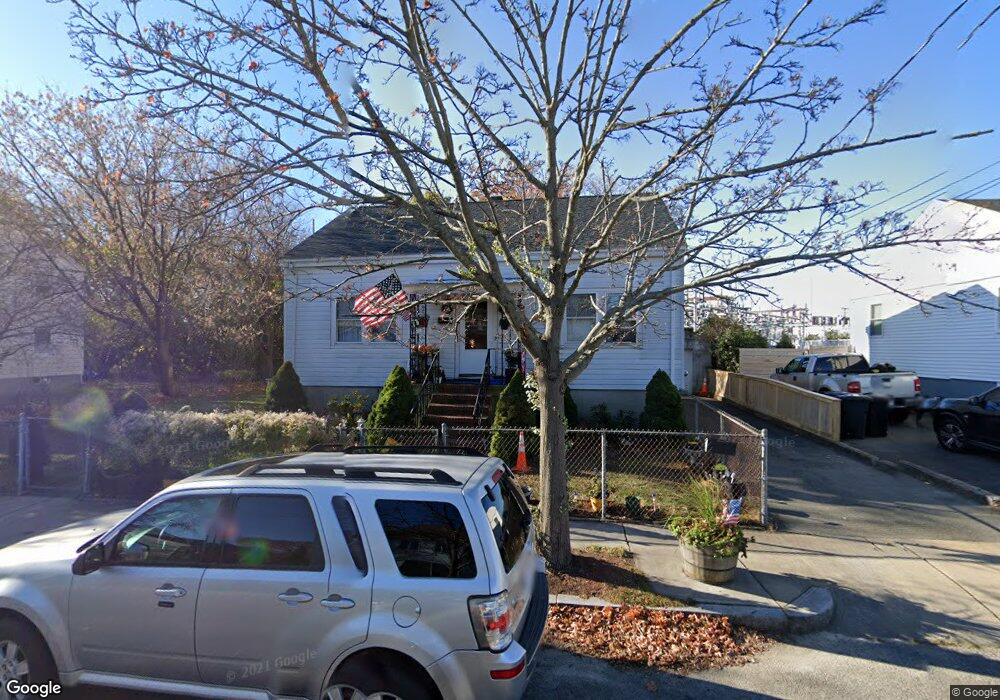
29 Coleman St Malden, MA 02148
Linden NeighborhoodEstimated Value: $746,120 - $1,087,000
4
Beds
2
Baths
1,754
Sq Ft
$521/Sq Ft
Est. Value
About This Home
This home is located at 29 Coleman St, Malden, MA 02148 and is currently estimated at $913,780, approximately $520 per square foot. 29 Coleman St is a home located in Middlesex County with nearby schools including Malden High School and Malden Catholic.
Ownership History
Date
Name
Owned For
Owner Type
Purchase Details
Closed on
Aug 27, 1993
Sold by
Martone Gloria
Bought by
Brown Harold T and Brown Aimee R
Current Estimated Value
Home Financials for this Owner
Home Financials are based on the most recent Mortgage that was taken out on this home.
Original Mortgage
$130,000
Interest Rate
7.06%
Mortgage Type
VA
Create a Home Valuation Report for This Property
The Home Valuation Report is an in-depth analysis detailing your home's value as well as a comparison with similar homes in the area
Home Values in the Area
Average Home Value in this Area
Purchase History
| Date | Buyer | Sale Price | Title Company |
|---|---|---|---|
| Brown Harold T | $130,000 | -- | |
| Brown Harold T | $130,000 | -- |
Source: Public Records
Mortgage History
| Date | Status | Borrower | Loan Amount |
|---|---|---|---|
| Open | Brown Harold T | $17,000 | |
| Closed | Brown Harold T | $130,000 | |
| Previous Owner | Brown Harold T | $12,000 |
Source: Public Records
Tax History Compared to Growth
Tax History
| Year | Tax Paid | Tax Assessment Tax Assessment Total Assessment is a certain percentage of the fair market value that is determined by local assessors to be the total taxable value of land and additions on the property. | Land | Improvement |
|---|---|---|---|---|
| 2025 | $68 | $602,000 | $297,200 | $304,800 |
| 2024 | $6,522 | $557,900 | $279,700 | $278,200 |
| 2023 | $6,295 | $516,400 | $253,500 | $262,900 |
| 2022 | $6,023 | $487,700 | $231,600 | $256,100 |
| 2021 | $6,338 | $515,700 | $218,500 | $297,200 |
| 2020 | $6,067 | $479,600 | $201,900 | $277,700 |
| 2019 | $5,845 | $440,500 | $192,300 | $248,200 |
| 2018 | $5,606 | $397,900 | $159,500 | $238,400 |
| 2017 | $5,475 | $386,400 | $159,500 | $226,900 |
| 2016 | $4,744 | $312,900 | $146,400 | $166,500 |
| 2015 | $4,642 | $295,100 | $139,400 | $155,700 |
| 2014 | $4,460 | $277,000 | $126,700 | $150,300 |
Source: Public Records
Map
Nearby Homes
- 363 Broadway
- 14 Dodge St
- 115 Webster St
- 19 Bellvale St
- 1135 Salem St
- 33 Lodgen Ct Unit 4G
- 48 Summit St
- 26 Webber St Unit 1
- 33 Blaine St
- 98 Summit St
- 112 Hadley St
- 18 Lynn St
- 4 Anderson Way Unit 2
- 7 Sawyer Ct
- 15 Mount Washington Ave
- 36 Central Ave
- 10 Birch Ln
- 75 Goldie St
- 82 Elwell St
- 0 Beachview Ave
- 28 Coleman St Unit 30
- 28 Coleman St Unit 1
- 23 Coleman St
- 23 Coleman St Unit 1
- 17 Coleman St
- 13 Coleman St Unit B
- 13 Coleman St Unit A
- 13 Coleman St
- 13 Coleman St Unit 13A
- 43 Plainfield Ave
- 19 Plainfield Ave
- 51 Plainfield Ave
- 11 Coleman St
- 16 Plainfield Ave
- 9 Plainfield Ave Unit 9
- 1130 Eastern Ave
- 56 Plainfield Ave Unit 2
- 54 Plainfield Ave Unit 56
- 1152 Eastern Ave
- 273 Broadway