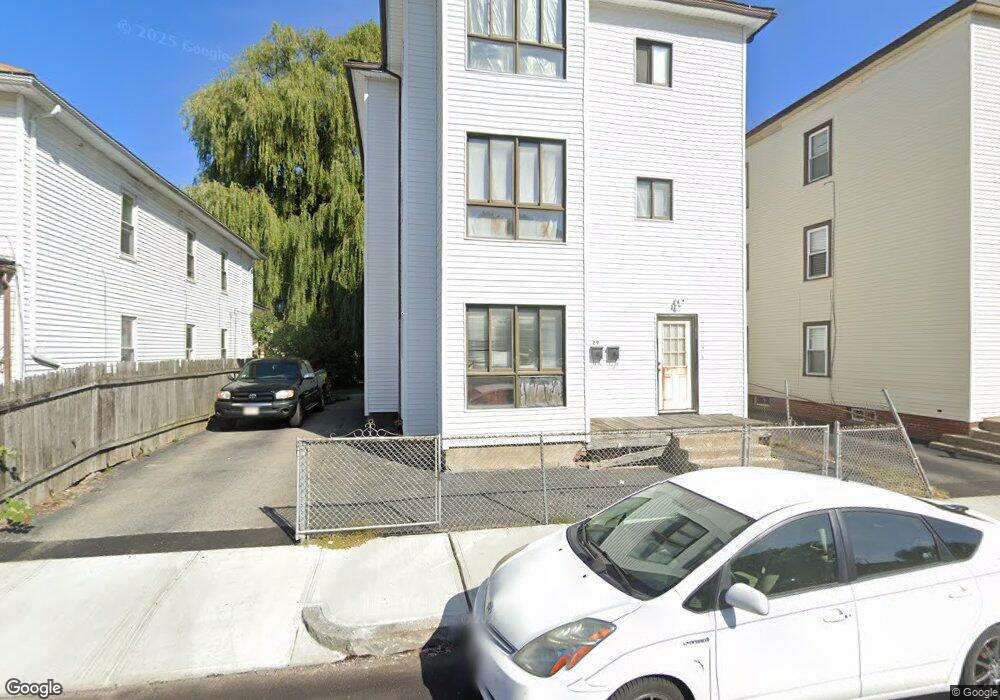
29 Colton St Worcester, MA 01610
South Worcester NeighborhoodEstimated Value: $641,000 - $811,000
9
Beds
3
Baths
3,183
Sq Ft
$234/Sq Ft
Est. Value
About This Home
This home is located at 29 Colton St, Worcester, MA 01610 and is currently estimated at $746,000, approximately $234 per square foot. 29 Colton St is a home located in Worcester County with nearby schools including Jacob Hiatt Magnet School, Chandler Elementary Community School, and Chandler Magnet.
Ownership History
Date
Name
Owned For
Owner Type
Purchase Details
Closed on
Sep 19, 2019
Sold by
Railey Mary B
Bought by
Railey Mary B and Railey Christian T
Current Estimated Value
Purchase Details
Closed on
Feb 17, 1998
Sold by
Forte Margaret J
Bought by
Railey Christian J
Purchase Details
Closed on
May 30, 1991
Sold by
Barrett James D
Bought by
Forte Glenn P
Purchase Details
Closed on
Jan 16, 1991
Sold by
Plantations Invest Ltd
Bought by
Barrett James
Create a Home Valuation Report for This Property
The Home Valuation Report is an in-depth analysis detailing your home's value as well as a comparison with similar homes in the area
Home Values in the Area
Average Home Value in this Area
Purchase History
| Date | Buyer | Sale Price | Title Company |
|---|---|---|---|
| Railey Mary B | -- | -- | |
| Railey Christian J | $25,000 | -- | |
| Forte Glenn P | $25,000 | -- | |
| Barrett James | $2,100 | -- |
Source: Public Records
Tax History
| Year | Tax Paid | Tax Assessment Tax Assessment Total Assessment is a certain percentage of the fair market value that is determined by local assessors to be the total taxable value of land and additions on the property. | Land | Improvement |
|---|---|---|---|---|
| 2025 | $5,437 | $412,200 | $50,000 | $362,200 |
| 2024 | $4,994 | $363,200 | $50,000 | $313,200 |
| 2023 | $4,735 | $330,200 | $39,500 | $290,700 |
| 2022 | $4,126 | $271,300 | $31,600 | $239,700 |
| 2021 | $4,002 | $245,800 | $25,300 | $220,500 |
| 2020 | $3,500 | $205,900 | $25,300 | $180,600 |
| 2019 | $3,541 | $196,700 | $24,100 | $172,600 |
| 2018 | $3,447 | $182,300 | $24,100 | $158,200 |
| 2017 | $3,219 | $167,500 | $24,100 | $143,400 |
| 2016 | $3,096 | $150,200 | $17,000 | $133,200 |
| 2015 | $3,015 | $150,200 | $17,000 | $133,200 |
| 2014 | $2,935 | $150,200 | $17,000 | $133,200 |
Source: Public Records
Map
Nearby Homes
- 20 Washburn St
- 607 Cambridge St Unit 4
- 172 Perry Ave Unit 1A
- 172 Perry Ave Unit 2B
- 13 Sigel St
- 200 Beacon St
- 3A Gediminas St
- 195 Millbury St
- 69 Oread St
- 15 Gardner St
- 5 Ripley Place
- 17 Euclid Ave
- 93 Fairfax Rd
- 4 Maxwell Ct
- 13 Sterling St
- 26 Maxwell St
- 14 Hancock St
- 49 Richland St
- 9 1/2 Ames St Unit 2
- 7 Wyman St
Your Personal Tour Guide
Ask me questions while you tour the home.