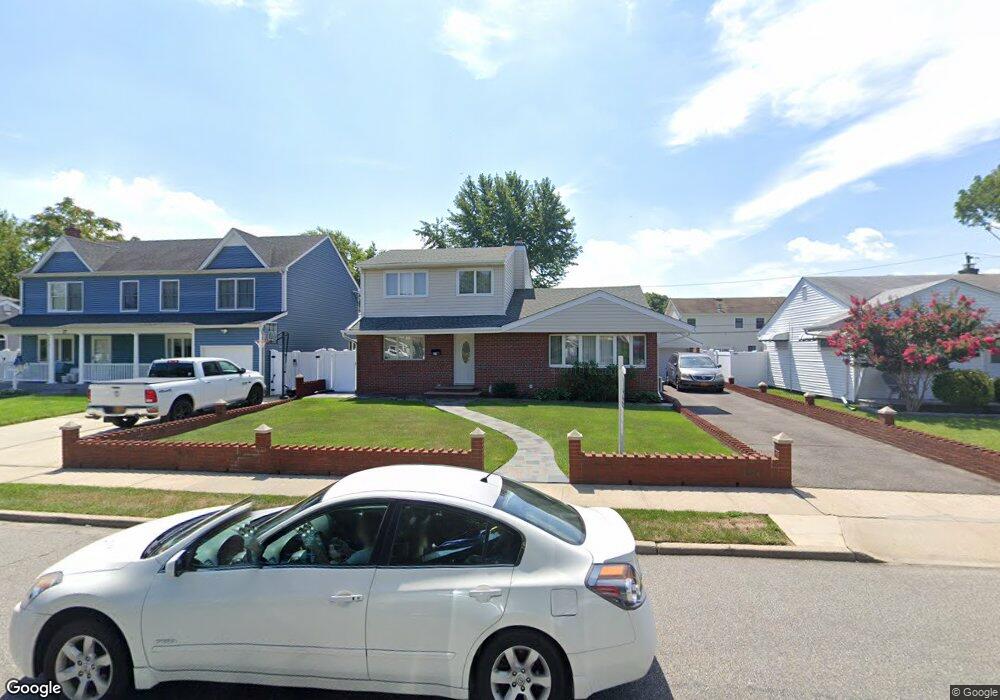
29 Dennis Ln Bethpage, NY 11714
Estimated Value: $808,000 - $820,267
4
Beds
3
Baths
1,600
Sq Ft
$509/Sq Ft
Est. Value
About This Home
This home is located at 29 Dennis Ln, Bethpage, NY 11714 and is currently estimated at $814,134, approximately $508 per square foot. 29 Dennis Ln is a home located in Nassau County with nearby schools including John H. West Elementary School, Plainedge Middle School, and Plainedge Senior High School.
Ownership History
Date
Name
Owned For
Owner Type
Purchase Details
Closed on
May 20, 2020
Sold by
Grgurovic Mladen and Grgurovic Sonja
Bought by
Singh Navneet and Singh Safranjot
Current Estimated Value
Home Financials for this Owner
Home Financials are based on the most recent Mortgage that was taken out on this home.
Original Mortgage
$471,750
Outstanding Balance
$416,318
Interest Rate
3.2%
Mortgage Type
New Conventional
Estimated Equity
$397,816
Create a Home Valuation Report for This Property
The Home Valuation Report is an in-depth analysis detailing your home's value as well as a comparison with similar homes in the area
Home Values in the Area
Average Home Value in this Area
Purchase History
| Date | Buyer | Sale Price | Title Company |
|---|---|---|---|
| Singh Navneet | $555,000 | None Available | |
| Singh Navneet | $555,000 | None Available | |
| Singh Navneet | $555,000 | None Available |
Source: Public Records
Mortgage History
| Date | Status | Borrower | Loan Amount |
|---|---|---|---|
| Open | Singh Navneet | $471,750 | |
| Closed | Singh Navneet | $471,750 |
Source: Public Records
Tax History Compared to Growth
Tax History
| Year | Tax Paid | Tax Assessment Tax Assessment Total Assessment is a certain percentage of the fair market value that is determined by local assessors to be the total taxable value of land and additions on the property. | Land | Improvement |
|---|---|---|---|---|
| 2025 | $14,988 | $463 | $210 | $253 |
| 2024 | $4,711 | $495 | $225 | $270 |
| 2023 | $16,254 | $528 | $240 | $288 |
| 2022 | $16,254 | $544 | $247 | $297 |
| 2021 | $17,079 | $522 | $237 | $285 |
| 2020 | $16,870 | $757 | $445 | $312 |
| 2019 | $4,312 | $757 | $445 | $312 |
| 2018 | $9,880 | $757 | $0 | $0 |
| 2017 | $9,880 | $757 | $445 | $312 |
| 2016 | $13,836 | $757 | $445 | $312 |
| 2015 | $3,526 | $757 | $445 | $312 |
| 2014 | $3,526 | $757 | $445 | $312 |
| 2013 | $3,206 | $757 | $445 | $312 |
Source: Public Records
Map
Nearby Homes