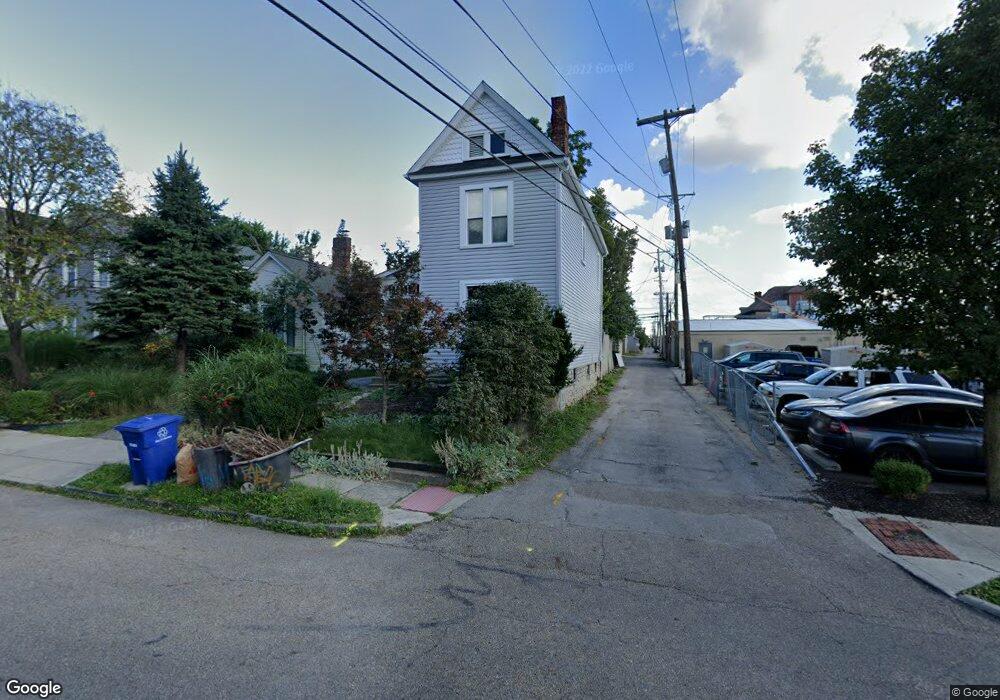
29 E Dodridge St Columbus, OH 43202
Old North Columbus NeighborhoodEstimated Value: $347,000 - $384,000
3
Beds
1
Bath
1,560
Sq Ft
$234/Sq Ft
Est. Value
About This Home
This home is located at 29 E Dodridge St, Columbus, OH 43202 and is currently estimated at $364,811, approximately $233 per square foot. 29 E Dodridge St is a home located in Franklin County with nearby schools including Clinton Elementary School, Dominion Middle School, and Whetstone High School.
Ownership History
Date
Name
Owned For
Owner Type
Purchase Details
Closed on
Nov 5, 2019
Sold by
Der Heijden Merijtje Van and Der Bela Koe
Bought by
Der Heijden Merijintje Van
Current Estimated Value
Home Financials for this Owner
Home Financials are based on the most recent Mortgage that was taken out on this home.
Original Mortgage
$125,200
Interest Rate
3.5%
Mortgage Type
New Conventional
Purchase Details
Closed on
Feb 13, 2004
Sold by
Housh Jason D and Black Housh M Candace
Bought by
Vanderheijden Merijn and Koe Krompecher Bela
Home Financials for this Owner
Home Financials are based on the most recent Mortgage that was taken out on this home.
Original Mortgage
$110,200
Interest Rate
7.62%
Mortgage Type
Purchase Money Mortgage
Purchase Details
Closed on
Oct 1, 1987
Purchase Details
Closed on
Jul 1, 1986
Create a Home Valuation Report for This Property
The Home Valuation Report is an in-depth analysis detailing your home's value as well as a comparison with similar homes in the area
Home Values in the Area
Average Home Value in this Area
Purchase History
| Date | Buyer | Sale Price | Title Company |
|---|---|---|---|
| Der Heijden Merijintje Van | $20,000 | Amrock Inc | |
| Vanderheijden Merijn | $116,000 | Foundation Title | |
| -- | $51,000 | -- | |
| -- | $45,900 | -- |
Source: Public Records
Mortgage History
| Date | Status | Borrower | Loan Amount |
|---|---|---|---|
| Previous Owner | Der Heijden Merijintje Van | $125,200 | |
| Previous Owner | Vanderheijden Merijn | $110,200 |
Source: Public Records
Tax History
| Year | Tax Paid | Tax Assessment Tax Assessment Total Assessment is a certain percentage of the fair market value that is determined by local assessors to be the total taxable value of land and additions on the property. | Land | Improvement |
|---|---|---|---|---|
| 2025 | $4,755 | $105,950 | $33,360 | $72,590 |
| 2024 | $4,755 | $105,950 | $33,360 | $72,590 |
| 2023 | $4,694 | $105,950 | $33,360 | $72,590 |
| 2022 | $3,145 | $60,630 | $18,870 | $41,760 |
| 2021 | $3,150 | $60,630 | $18,870 | $41,760 |
| 2020 | $3,154 | $60,630 | $18,870 | $41,760 |
| 2019 | $2,756 | $45,430 | $14,490 | $30,940 |
| 2018 | $2,718 | $45,430 | $14,490 | $30,940 |
| 2017 | $2,856 | $45,430 | $14,490 | $30,940 |
| 2016 | $2,958 | $44,660 | $8,960 | $35,700 |
| 2015 | $2,686 | $44,660 | $8,960 | $35,700 |
| 2014 | $2,692 | $44,660 | $8,960 | $35,700 |
| 2013 | $1,264 | $42,525 | $8,540 | $33,985 |
Source: Public Records
Map
Nearby Homes
- 74 E Dodridge St
- 109 E Arcadia Ave
- 2683 Neil Ave Unit 685
- 53 Olentangy St
- 2540 Neil Ave
- 2717 Hibbert Ave
- 6 E Blake Ave
- 29 Crestview Rd
- 23 E Maynard Ave
- 2394 Neil Ave
- 2478-2480 Deming Ave
- 2458- 2458 1 2 Deming Ave
- 210 E Blake Ave
- 366 Parkview Dr Unit 366
- 2470 Indianola Ave
- 2771 Indianola Ave
- 415 Glen Echo Cir
- 3021 N High St
- 68 E Oakland Ave
- 2804 Indianola Ave
- 31 E Dodridge St
- 37 E Dodridge St
- 39 E Dodridge St Unit 41
- 39-41 E Dodridge St
- 43 E Dodridge St
- 2657 East Ave Unit 659
- 2657-2659 East Ave
- 40 E Dodridge St
- 30 E Dodridge St
- 2685 East Ave
- 2685 East Ave Unit 4
- 34 E Dodridge St Unit 36
- 24-26 E Duncan St
- 2426 Duncan St
- 57 E Dodridge St
- 2680 N High St
- 2650 East Ave
- 24 E Duncan St
- 63 E Dodridge St
- 2640 East Ave Unit 645
Your Personal Tour Guide
Ask me questions while you tour the home.