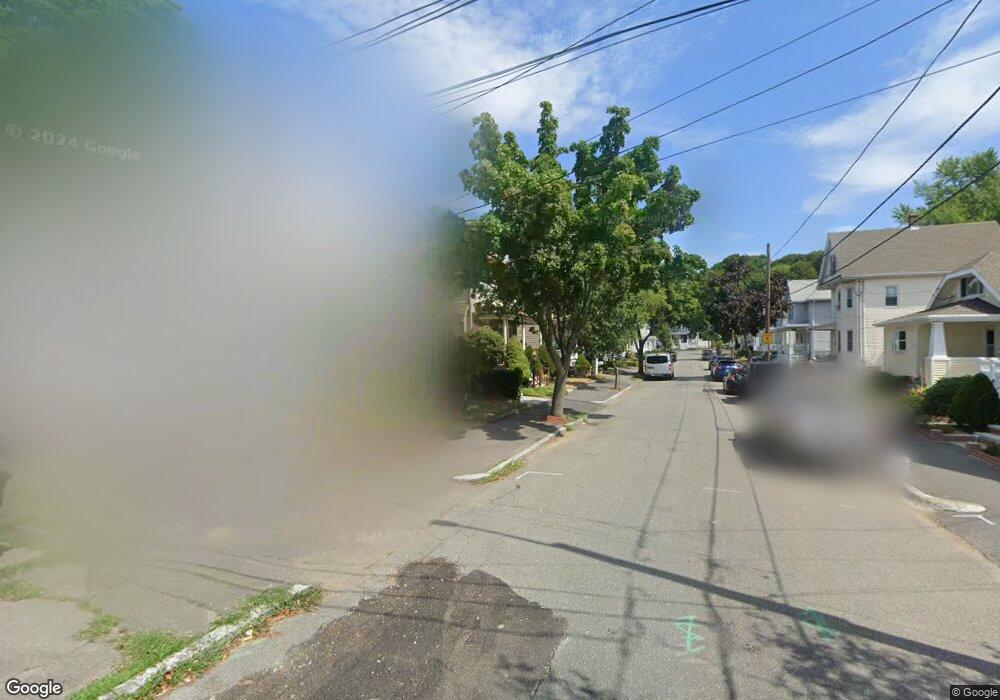
29 Eddie St Quincy, MA 02169
West Quincy NeighborhoodEstimated Value: $744,000 - $815,000
3
Beds
1
Bath
1,622
Sq Ft
$481/Sq Ft
Est. Value
About This Home
This home is located at 29 Eddie St, Quincy, MA 02169 and is currently estimated at $779,721, approximately $480 per square foot. 29 Eddie St is a home located in Norfolk County with nearby schools including Charles A. Bernazzani Elementary School, Central Middle School, and North Quincy High School.
Ownership History
Date
Name
Owned For
Owner Type
Purchase Details
Closed on
Jan 28, 2016
Sold by
Casper Francis X and Casper Jeanne M
Bought by
Casper Francis X and Casper Jeanne M
Current Estimated Value
Purchase Details
Closed on
Nov 22, 1978
Bought by
Casper Francis X and Casper Jeanne M
Create a Home Valuation Report for This Property
The Home Valuation Report is an in-depth analysis detailing your home's value as well as a comparison with similar homes in the area
Home Values in the Area
Average Home Value in this Area
Purchase History
| Date | Buyer | Sale Price | Title Company |
|---|---|---|---|
| Casper Francis X | -- | -- | |
| Casper Francis X | -- | -- |
Source: Public Records
Mortgage History
| Date | Status | Borrower | Loan Amount |
|---|---|---|---|
| Previous Owner | Casper Francis X | $120,000 | |
| Previous Owner | Casper Francis X | $40,000 | |
| Previous Owner | Casper Francis X | $22,907 |
Source: Public Records
Tax History Compared to Growth
Tax History
| Year | Tax Paid | Tax Assessment Tax Assessment Total Assessment is a certain percentage of the fair market value that is determined by local assessors to be the total taxable value of land and additions on the property. | Land | Improvement |
|---|---|---|---|---|
| 2025 | $8,095 | $702,100 | $310,700 | $391,400 |
| 2024 | $7,837 | $695,400 | $310,700 | $384,700 |
| 2023 | $7,287 | $654,700 | $295,900 | $358,800 |
| 2022 | $6,853 | $572,000 | $236,700 | $335,300 |
| 2021 | $5,329 | $439,000 | $236,700 | $202,300 |
| 2020 | $5,249 | $422,300 | $236,700 | $185,600 |
| 2019 | $4,994 | $397,900 | $221,200 | $176,700 |
| 2018 | $5,077 | $380,600 | $201,100 | $179,500 |
| 2017 | $5,155 | $363,800 | $201,100 | $162,700 |
| 2016 | $4,824 | $335,900 | $182,800 | $153,100 |
| 2015 | $4,476 | $306,600 | $166,200 | $140,400 |
| 2014 | $4,461 | $300,200 | $158,300 | $141,900 |
Source: Public Records
Map
Nearby Homes