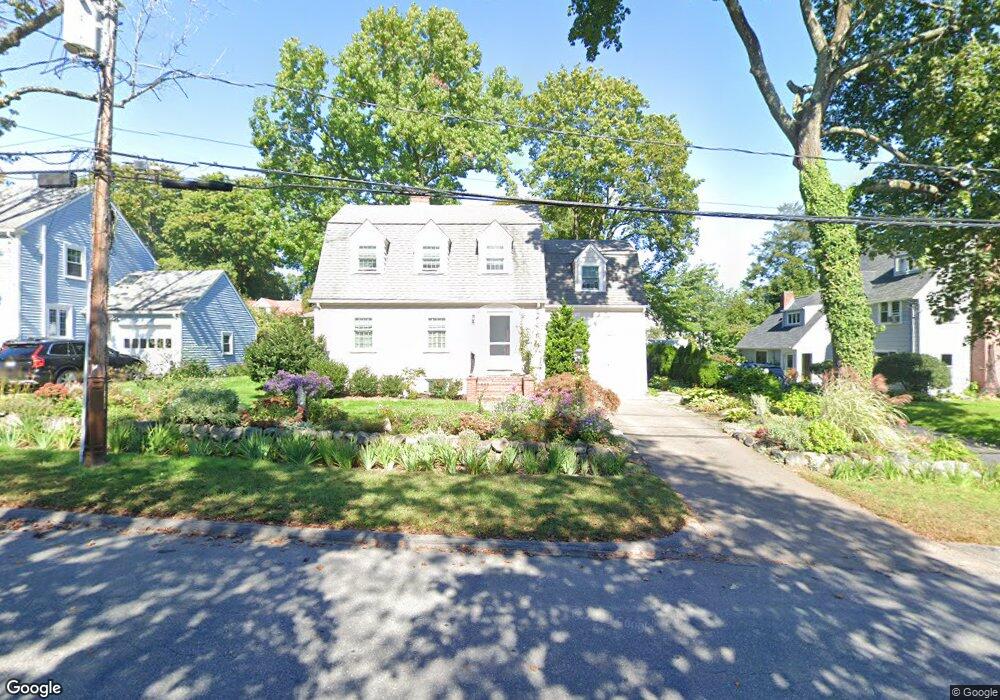
29 Elm St Belmont, MA 02478
Cushing Square NeighborhoodEstimated Value: $1,401,187 - $1,507,000
4
Beds
2
Baths
1,851
Sq Ft
$784/Sq Ft
Est. Value
About This Home
This home is located at 29 Elm St, Belmont, MA 02478 and is currently estimated at $1,450,297, approximately $783 per square foot. 29 Elm St is a home located in Middlesex County with nearby schools including Mary Lee Burbank Elementary School, Winthrop L Chenery Middle School, and Belmont High School.
Ownership History
Date
Name
Owned For
Owner Type
Purchase Details
Closed on
Jan 13, 2015
Sold by
Mcpherson Malcolm F and Hoover Deborah A
Bought by
29 Elm Street Belmont
Current Estimated Value
Purchase Details
Closed on
Oct 13, 1989
Sold by
Hanley George A
Bought by
Mcpherson Malcolm F
Home Financials for this Owner
Home Financials are based on the most recent Mortgage that was taken out on this home.
Original Mortgage
$100,000
Interest Rate
10.13%
Mortgage Type
Purchase Money Mortgage
Create a Home Valuation Report for This Property
The Home Valuation Report is an in-depth analysis detailing your home's value as well as a comparison with similar homes in the area
Home Values in the Area
Average Home Value in this Area
Purchase History
| Date | Buyer | Sale Price | Title Company |
|---|---|---|---|
| 29 Elm Street Belmont | -- | -- | |
| Mcpherson Malcolm F | $275,000 | -- |
Source: Public Records
Mortgage History
| Date | Status | Borrower | Loan Amount |
|---|---|---|---|
| Previous Owner | Mcpherson Malcolm F | $100,000 |
Source: Public Records
Tax History Compared to Growth
Tax History
| Year | Tax Paid | Tax Assessment Tax Assessment Total Assessment is a certain percentage of the fair market value that is determined by local assessors to be the total taxable value of land and additions on the property. | Land | Improvement |
|---|---|---|---|---|
| 2025 | $13,873 | $1,218,000 | $767,000 | $451,000 |
| 2024 | $13,348 | $1,264,000 | $908,000 | $356,000 |
| 2023 | $13,263 | $1,180,000 | $857,000 | $323,000 |
| 2022 | $14,183 | $1,084,000 | $784,000 | $300,000 |
| 2021 | $14,183 | $1,229,000 | $980,000 | $249,000 |
| 2020 | $11,968 | $1,088,000 | $839,000 | $249,000 |
| 2019 | $10,246 | $878,000 | $634,000 | $244,000 |
| 2018 | $9,975 | $821,000 | $577,000 | $244,000 |
| 2017 | $9,530 | $751,000 | $507,000 | $244,000 |
| 2016 | $9,407 | $749,000 | $507,000 | $242,000 |
| 2015 | $8,733 | $677,000 | $436,000 | $241,000 |
Source: Public Records
Map
Nearby Homes
- 73 Foster Rd Unit 2
- 276 Belmont St Unit 1
- 147 Langdon Ave Unit 149
- 36 Madison St
- 133 Hillside Rd
- 30 Unity Ave Unit 30
- 456 Belmont St Unit 10
- 456 Belmont St Unit 21
- 10 Marlboro St Unit 1
- 105 Watson Rd
- 56-58 Edgecliff Rd
- 125 Trapelo Rd Unit 21
- 125 Trapelo Rd Unit 23
- 81 Winsor Ave
- 87 Templeton Pkwy Unit 3
- 163 Belmont St
- 16 Ericsson St
- 263 Common St
- 118 Blanchard Rd
- 161 Cushing St