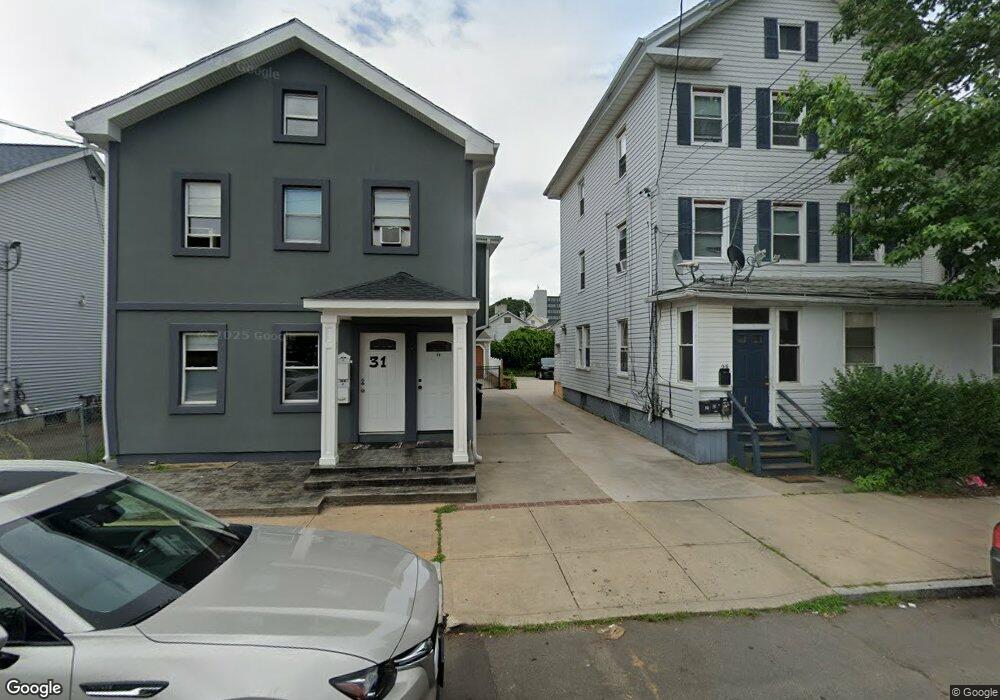
29 Fillmore St New Haven, CT 06513
Fair Haven NeighborhoodEstimated Value: $316,962 - $346,000
4
Beds
2
Baths
1,844
Sq Ft
$180/Sq Ft
Est. Value
About This Home
This home is located at 29 Fillmore St, New Haven, CT 06513 and is currently estimated at $331,991, approximately $180 per square foot. 29 Fillmore St is a home located in New Haven County with nearby schools including Clinton Avenue School, Elm City College Preparatory School, and St Francis & St Rose Of Lima School.
Ownership History
Date
Name
Owned For
Owner Type
Purchase Details
Closed on
Jan 20, 2010
Sold by
Rodriguez Galo
Bought by
Madariaga Erika
Current Estimated Value
Purchase Details
Closed on
Sep 22, 2009
Sold by
Madariaga Erika
Bought by
Rodriguez Galo
Purchase Details
Closed on
Dec 5, 2007
Sold by
Marquez John
Bought by
Rodriguez Galo
Home Financials for this Owner
Home Financials are based on the most recent Mortgage that was taken out on this home.
Original Mortgage
$195,000
Interest Rate
6.37%
Create a Home Valuation Report for This Property
The Home Valuation Report is an in-depth analysis detailing your home's value as well as a comparison with similar homes in the area
Home Values in the Area
Average Home Value in this Area
Purchase History
| Date | Buyer | Sale Price | Title Company |
|---|---|---|---|
| Madariaga Erika | -- | -- | |
| Rodriguez Galo | -- | -- | |
| Rodriguez Galo | $195,000 | -- |
Source: Public Records
Mortgage History
| Date | Status | Borrower | Loan Amount |
|---|---|---|---|
| Open | Rodriguez Galo | $34,953 | |
| Previous Owner | Rodriguez Galo | $195,000 | |
| Previous Owner | Rodriguez Galo | $139,000 |
Source: Public Records
Tax History Compared to Growth
Tax History
| Year | Tax Paid | Tax Assessment Tax Assessment Total Assessment is a certain percentage of the fair market value that is determined by local assessors to be the total taxable value of land and additions on the property. | Land | Improvement |
|---|---|---|---|---|
| 2025 | $5,475 | $138,950 | $26,600 | $112,350 |
| 2024 | $5,350 | $138,950 | $26,600 | $112,350 |
| 2023 | $5,169 | $138,950 | $26,600 | $112,350 |
| 2022 | $5,523 | $138,950 | $26,600 | $112,350 |
| 2021 | $3,422 | $77,980 | $21,280 | $56,700 |
| 2020 | $3,422 | $77,980 | $21,280 | $56,700 |
| 2019 | $3,352 | $77,980 | $21,280 | $56,700 |
| 2018 | $3,352 | $77,980 | $21,280 | $56,700 |
| 2017 | $3,016 | $77,980 | $21,280 | $56,700 |
| 2016 | $2,530 | $60,900 | $14,210 | $46,690 |
| 2015 | $2,530 | $60,900 | $14,210 | $46,690 |
| 2014 | $2,530 | $60,900 | $14,210 | $46,690 |
Source: Public Records
Map
Nearby Homes
- 25 Fillmore St
- 35 Fillmore St
- 21 Fillmore St
- 39 Fillmore St
- 17 Fillmore St
- 296 Poplar St
- 43 Fillmore St
- 294 Poplar St
- 13 Fillmore St
- 288 Poplar St
- 284 Poplar St
- 47 Fillmore St
- 306 Poplar St
- 304 Poplar St
- 302 Poplar St
- 300 Poplar St
- 298 Poplar St
- 298 Poplar St Unit 298
- 306 Poplar St Unit 306
- 304 Poplar St Unit 304