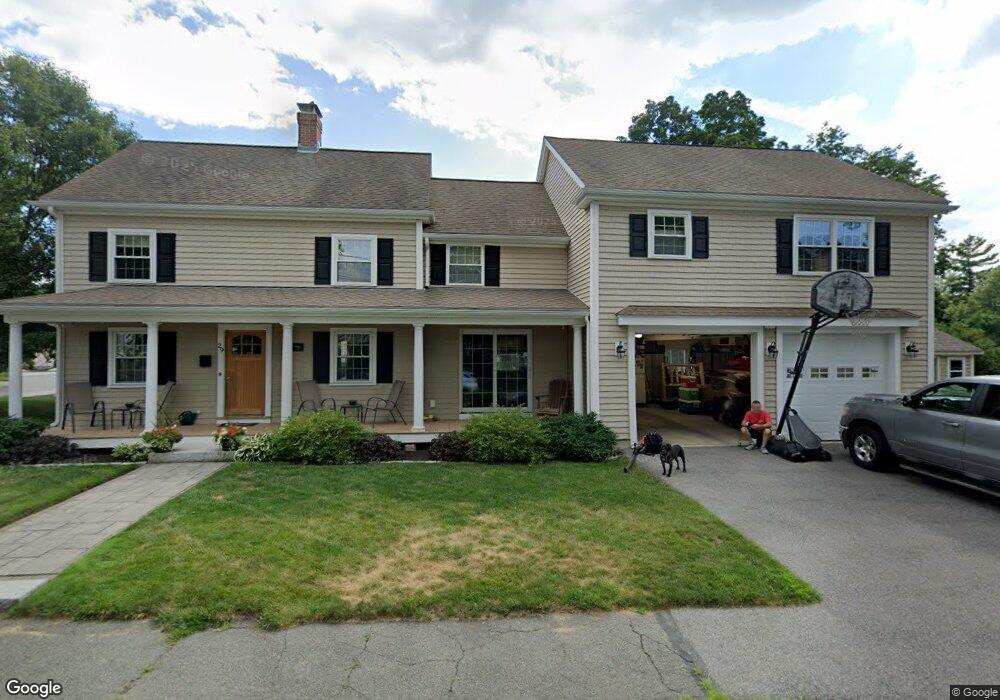
29 Fiske St Natick, MA 01760
Estimated Value: $940,676 - $1,112,000
2
Beds
1
Bath
2,361
Sq Ft
$436/Sq Ft
Est. Value
About This Home
This home is located at 29 Fiske St, Natick, MA 01760 and is currently estimated at $1,028,669, approximately $435 per square foot. 29 Fiske St is a home located in Middlesex County with nearby schools including Natick High School, J F Kennedy Middle School, and Johnson Elementary School.
Ownership History
Date
Name
Owned For
Owner Type
Purchase Details
Closed on
May 30, 1990
Sold by
Mildred Bragg Est C
Bought by
Levey Kenneth E
Current Estimated Value
Home Financials for this Owner
Home Financials are based on the most recent Mortgage that was taken out on this home.
Original Mortgage
$143,500
Interest Rate
10.25%
Mortgage Type
Purchase Money Mortgage
Create a Home Valuation Report for This Property
The Home Valuation Report is an in-depth analysis detailing your home's value as well as a comparison with similar homes in the area
Home Values in the Area
Average Home Value in this Area
Purchase History
| Date | Buyer | Sale Price | Title Company |
|---|---|---|---|
| Levey Kenneth E | $161,000 | -- |
Source: Public Records
Mortgage History
| Date | Status | Borrower | Loan Amount |
|---|---|---|---|
| Open | Levey Kenneth E | $50,000 | |
| Open | Levey Kenneth E | $90,000 | |
| Open | Levey Kenneth E | $144,000 | |
| Closed | Levey Kenneth E | $143,500 |
Source: Public Records
Tax History Compared to Growth
Tax History
| Year | Tax Paid | Tax Assessment Tax Assessment Total Assessment is a certain percentage of the fair market value that is determined by local assessors to be the total taxable value of land and additions on the property. | Land | Improvement |
|---|---|---|---|---|
| 2025 | $9,313 | $778,700 | $391,300 | $387,400 |
| 2024 | $8,995 | $733,700 | $368,300 | $365,400 |
| 2023 | $8,991 | $711,300 | $354,400 | $356,900 |
| 2022 | $8,550 | $640,900 | $322,200 | $318,700 |
| 2021 | $6,191 | $602,500 | $303,800 | $298,700 |
| 2020 | $6,275 | $588,700 | $290,000 | $298,700 |
| 2019 | $10,901 | $588,700 | $290,000 | $298,700 |
| 2018 | $7,911 | $606,200 | $276,200 | $330,000 |
| 2017 | $0 | $558,800 | $234,800 | $324,000 |
| 2016 | $7,177 | $528,900 | $208,000 | $320,900 |
| 2015 | $6,938 | $502,000 | $208,000 | $294,000 |
Source: Public Records
Map
Nearby Homes
- 91 Speen St
- 1 Fern St
- 4 Sylvia Ave
- 40 Silver Hill Ln Unit 4
- 46 Silver Hill Ln Unit 1
- 9 Silver Hill Ln Unit 19
- 32 Silver Hill Ln Unit 1
- 26 Walden Dr Unit 4
- 2 Lodge Rd
- 12 Walden Dr Unit 19
- 16 West St
- 10 Kelsey Rd
- 25 Forest Ave
- 57 Village Brook Ln Unit 5
- 50 Village Brook Ln Unit 4
- 38 Ranger Rd
- 47 High St
- 51 Village Brook Ln Unit 16
- 216-218 S Main St
- 7 Orchard View Cir Unit 7