Estimated Value: $77,000 - $160,000
4
Beds
2
Baths
2,108
Sq Ft
$53/Sq Ft
Est. Value
About This Home
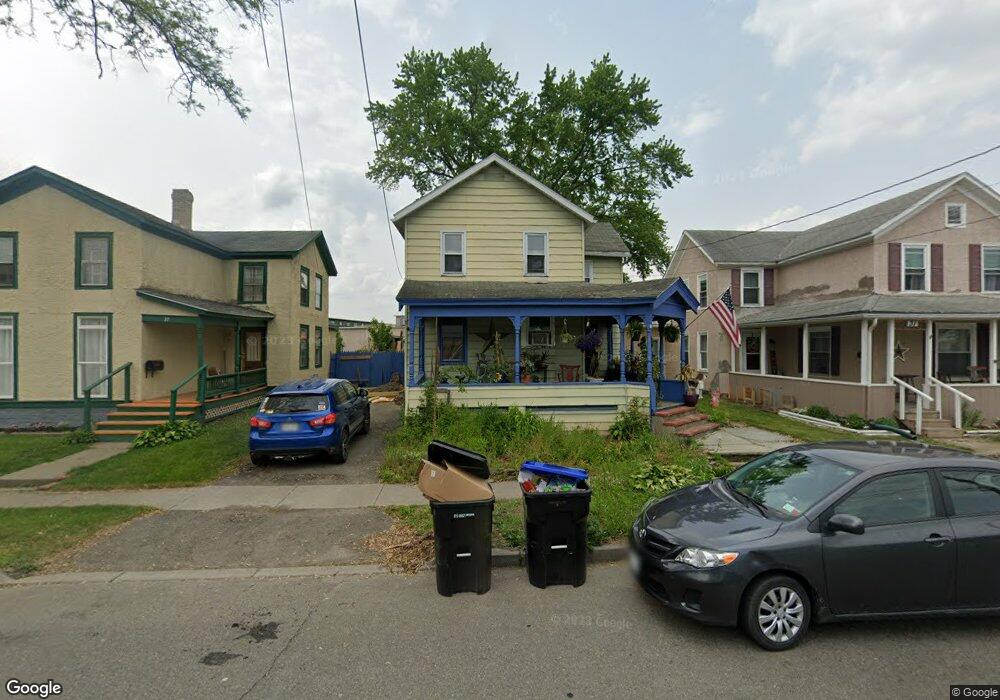
This home is located at 29 Fox St, Owego, NY 13827 and is currently estimated at $112,562, approximately $53 per square foot. 29 Fox St is a home located in Tioga County with nearby schools including Owego Elementary School, Owego-Apalachin Middle School, and Owego Free Academy.
Ownership History
Date
Name
Owned For
Owner Type
Purchase Details
Closed on
Oct 15, 2021
Sold by
Spicer Thomas
Bought by
Frechette Jolene and Morehead Yvonne
Current Estimated Value
Home Financials for this Owner
Home Financials are based on the most recent Mortgage that was taken out on this home.
Original Mortgage
$57,439
Outstanding Balance
$52,379
Interest Rate
2.8%
Mortgage Type
FHA
Estimated Equity
$60,183
Purchase Details
Closed on
Nov 30, 2007
Sold by
Bank Wells Fargo Na
Bought by
Spicer Thomas
Purchase Details
Closed on
Feb 21, 2007
Purchase Details
Closed on
Oct 9, 2002
Create a Home Valuation Report for This Property
The Home Valuation Report is an in-depth analysis detailing your home's value as well as a comparison with similar homes in the area
Home Values in the Area
Average Home Value in this Area
Purchase History
| Date | Buyer | Sale Price | Title Company |
|---|---|---|---|
| Frechette Jolene | $58,500 | None Available | |
| Spicer Thomas | $29,000 | Francis Battisti | |
| -- | $58,914 | -- | |
| -- | -- | -- |
Source: Public Records
Mortgage History
| Date | Status | Borrower | Loan Amount |
|---|---|---|---|
| Open | Frechette Jolene | $57,439 |
Source: Public Records
Tax History Compared to Growth
Tax History
| Year | Tax Paid | Tax Assessment Tax Assessment Total Assessment is a certain percentage of the fair market value that is determined by local assessors to be the total taxable value of land and additions on the property. | Land | Improvement |
|---|---|---|---|---|
| 2024 | $2,423 | $27,800 | $8,200 | $19,600 |
| 2023 | $12 | $27,800 | $8,200 | $19,600 |
| 2022 | $1,225 | $27,800 | $8,200 | $19,600 |
| 2021 | $1,217 | $27,800 | $8,200 | $19,600 |
| 2020 | $3,442 | $27,800 | $8,200 | $19,600 |
| 2019 | $1,201 | $27,800 | $8,200 | $19,600 |
| 2018 | $4,142 | $27,800 | $8,200 | $19,600 |
| 2017 | $4,086 | $27,800 | $8,200 | $19,600 |
| 2016 | $4,058 | $27,800 | $8,200 | $19,600 |
| 2015 | -- | $27,800 | $8,200 | $19,600 |
| 2014 | -- | $27,800 | $8,200 | $19,600 |
Source: Public Records
Map
Nearby Homes