Estimated Value: $191,000 - $333,000
2
Beds
1
Bath
1,008
Sq Ft
$275/Sq Ft
Est. Value
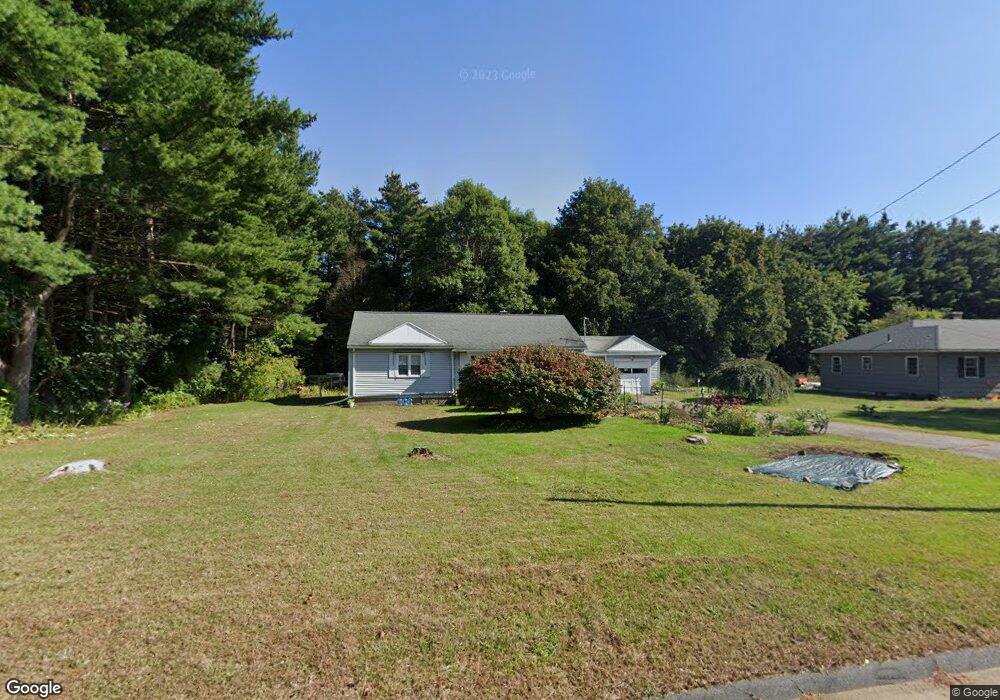
About This Home
This home is located at 29 Gould Rd, Ware, MA 01082 and is currently estimated at $276,707, approximately $274 per square foot. 29 Gould Rd is a home located in Hampshire County with nearby schools including Stanley M. Koziol Elementary School, Ware Middle School, and Ware Junior/Senior High School.
Ownership History
Date
Name
Owned For
Owner Type
Purchase Details
Closed on
Jun 30, 2009
Sold by
Sterndale Richard D and Greenberg Beverly
Bought by
Wheeler Diane M
Current Estimated Value
Home Financials for this Owner
Home Financials are based on the most recent Mortgage that was taken out on this home.
Original Mortgage
$145,000
Outstanding Balance
$92,743
Interest Rate
4.92%
Mortgage Type
Purchase Money Mortgage
Estimated Equity
$183,964
Purchase Details
Closed on
Jan 8, 2001
Sold by
Wypych Michael P Est and Wypych Admin Paul F
Bought by
Greenberg Beverly Ann and Sterndale Richard D
Create a Home Valuation Report for This Property
The Home Valuation Report is an in-depth analysis detailing your home's value as well as a comparison with similar homes in the area
Home Values in the Area
Average Home Value in this Area
Purchase History
| Date | Buyer | Sale Price | Title Company |
|---|---|---|---|
| Wheeler Diane M | $145,000 | -- | |
| Greenberg Beverly Ann | $95,500 | -- |
Source: Public Records
Mortgage History
| Date | Status | Borrower | Loan Amount |
|---|---|---|---|
| Open | Wheeler Diane M | $145,000 |
Source: Public Records
Tax History
| Year | Tax Paid | Tax Assessment Tax Assessment Total Assessment is a certain percentage of the fair market value that is determined by local assessors to be the total taxable value of land and additions on the property. | Land | Improvement |
|---|---|---|---|---|
| 2025 | $3,270 | $217,100 | $45,300 | $171,800 |
| 2024 | $3,139 | $192,200 | $42,800 | $149,400 |
| 2023 | $3,155 | $182,800 | $41,200 | $141,600 |
| 2022 | $3,104 | $160,500 | $38,100 | $122,400 |
| 2021 | $3,035 | $150,400 | $38,100 | $112,300 |
| 2020 | $2,954 | $143,200 | $38,100 | $105,100 |
| 2019 | $2,894 | $143,200 | $38,100 | $105,100 |
| 2018 | $2,788 | $134,600 | $37,100 | $97,500 |
| 2017 | $2,578 | $124,100 | $37,100 | $87,000 |
| 2016 | $2,508 | $124,100 | $37,100 | $87,000 |
| 2015 | $2,439 | $124,100 | $37,100 | $87,000 |
| 2014 | $2,362 | $129,000 | $37,700 | $91,300 |
Source: Public Records
Map
Nearby Homes
- 201 West St
- LOT 3 Monson Turnpike Rd
- 24 Clinton St
- 87 W Main St
- 23 West St Unit 25
- 7 Webb Ct
- 48 North St Unit 1
- 48 North St Unit 8
- 48 North St Unit 9
- 79 Pleasant St
- 3 Church St
- 22 Vigeant St
- 22 Church St
- 14 Bellevue Ave
- 99 North St
- 51 Church St
- 6 Winslow Rd
- 3 Williston Dr
- 375 Belchertown Rd
- 67 Babcock Tavern Rd
Your Personal Tour Guide
Ask me questions while you tour the home.