
Seller's Agent in 2026
Laura Guisti-McSweeney
ERA Key Realty Services- Milf
(508) 380-9350
1 in this area
51 Total Sales
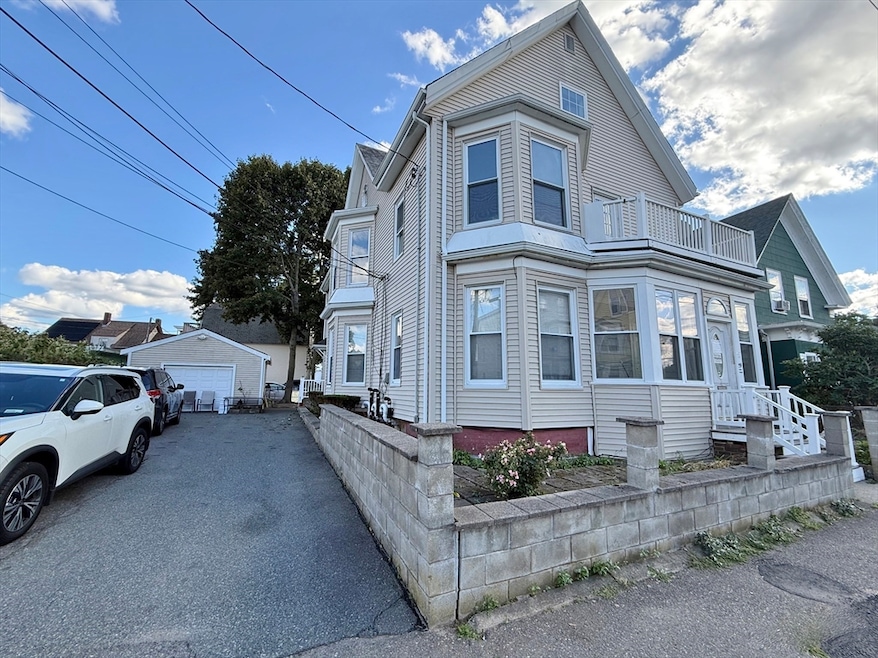


This renovated, nicely maintained & spacious Multi-Unit is a fantastic investment opportunity to live-in & rent, or rent both units as an investment property. The 1st flr Unit is a large & spacious 2 Bedroom/Full Bath w/beautiful architectural features; high coffered ceiling, gleaming hardwood floors & lots of tall windows for abundance of natural light. The 1st flr unit has direct interior access to the finished Walk-Out Basement w/Full Bath & offers multi-purpose use of the space. The 2nd flr up & down type unit w/2-4 Bedrooms/2 Full Baths, offers abundance of natural light, is very spacious, & has access to a rooftop deck. This property offers ample off street parking in the over-sized paved driveway, has 1 Car Garage, & a tree lined backyard for gatherings. Don't hesitate to make a move on this move-in ready investment. You wont be disappointed!
Last Agent to Sell the Property
ERA Key Realty Services- Milf Listed on: 09/02/2025
| Date | Type | Sale Price | Title Company |
|---|---|---|---|
| Quit Claim Deed | $820,000 | -- | |
| Quit Claim Deed | -- | None Available | |
| Quit Claim Deed | -- | None Available | |
| Quit Claim Deed | -- | -- | |
| Quit Claim Deed | -- | -- | |
| Deed | $45,000 | -- | |
| Deed | $45,000 | -- | |
| Foreclosure Deed | $87,000 | -- | |
| Foreclosure Deed | $87,000 | -- |
| Date | Status | Loan Amount | Loan Type |
|---|---|---|---|
| Open | $795,328 | FHA | |
| Previous Owner | $162,000 | No Value Available | |
| Previous Owner | $139,100 | No Value Available | |
| Previous Owner | $68,100 | No Value Available |
| Date | Event | Price | List to Sale | Price per Sq Ft |
|---|---|---|---|---|
| 01/07/2026 01/07/26 | Sold | $820,000 | +0.6% | $237 / Sq Ft |
| 10/29/2025 10/29/25 | Pending | -- | -- | -- |
| 10/28/2025 10/28/25 | For Sale | $815,000 | 0.0% | $236 / Sq Ft |
| 10/06/2025 10/06/25 | Pending | -- | -- | -- |
| 09/02/2025 09/02/25 | For Sale | $815,000 | -- | $236 / Sq Ft |
| Year | Tax Paid | Tax Assessment Tax Assessment Total Assessment is a certain percentage of the fair market value that is determined by local assessors to be the total taxable value of land and additions on the property. | Land | Improvement |
|---|---|---|---|---|
| 2025 | $8,150 | $673,000 | $133,800 | $539,200 |
| 2024 | $7,779 | $647,200 | $133,800 | $513,400 |
| 2023 | $7,451 | $574,000 | $100,700 | $473,300 |
| 2022 | $7,421 | $531,200 | $91,200 | $440,000 |
| 2021 | $6,721 | $463,500 | $75,200 | $388,300 |
| 2020 | $5,303 | $350,000 | $71,200 | $278,800 |
| 2019 | $5,386 | $346,600 | $68,400 | $278,200 |
| 2018 | $5,030 | $313,200 | $68,400 | $244,800 |
| 2017 | $4,996 | $310,300 | $68,400 | $241,900 |
| 2016 | $4,218 | $243,000 | $66,200 | $176,800 |
| 2015 | $4,024 | $221,700 | $66,200 | $155,500 |
| 2014 | $3,887 | $214,400 | $66,200 | $148,200 |
Seller's Agent in 2026
Laura Guisti-McSweeney
ERA Key Realty Services- Milf
(508) 380-9350
1 in this area
51 Total Sales
E
Buyer's Agent in 2026
Ernest Termitus
Topkey Realty
(617) 448-0258
1 in this area
4 Total Sales
Source: MLS Property Information Network (MLS PIN)
MLS Number: 73424285
APN: BROC-000114-000074
Disclaimer: Certain information contained herein is derived from information provided by parties other than Homes.com. All information provided is deemed reliable, but is not guaranteed to be accurate and should be independently verified.
![]() The property listing data and information, or the Images, set forth herein were provided to MLS Property Information Network, Inc. from third party sources, including sellers, lessors and public records, and were compiled by MLS Property Information Network, Inc. The property listing data and information, and the Images, are for the personal, non-commercial use of consumers having a good faith interest in purchasing or leasing listed properties of the type displayed to them and may not be used for any purpose other than to identify prospective properties which such consumers may have a good faith interest in purchasing or leasing. MLS Property Information Network, Inc. and its subscribers disclaim any and all representations and warranties as to the accuracy of the property listing data and information, or as to the accuracy of any of the Images, set forth herein.
The property listing data and information, or the Images, set forth herein were provided to MLS Property Information Network, Inc. from third party sources, including sellers, lessors and public records, and were compiled by MLS Property Information Network, Inc. The property listing data and information, and the Images, are for the personal, non-commercial use of consumers having a good faith interest in purchasing or leasing listed properties of the type displayed to them and may not be used for any purpose other than to identify prospective properties which such consumers may have a good faith interest in purchasing or leasing. MLS Property Information Network, Inc. and its subscribers disclaim any and all representations and warranties as to the accuracy of the property listing data and information, or as to the accuracy of any of the Images, set forth herein.
Ask me questions while you tour the home.