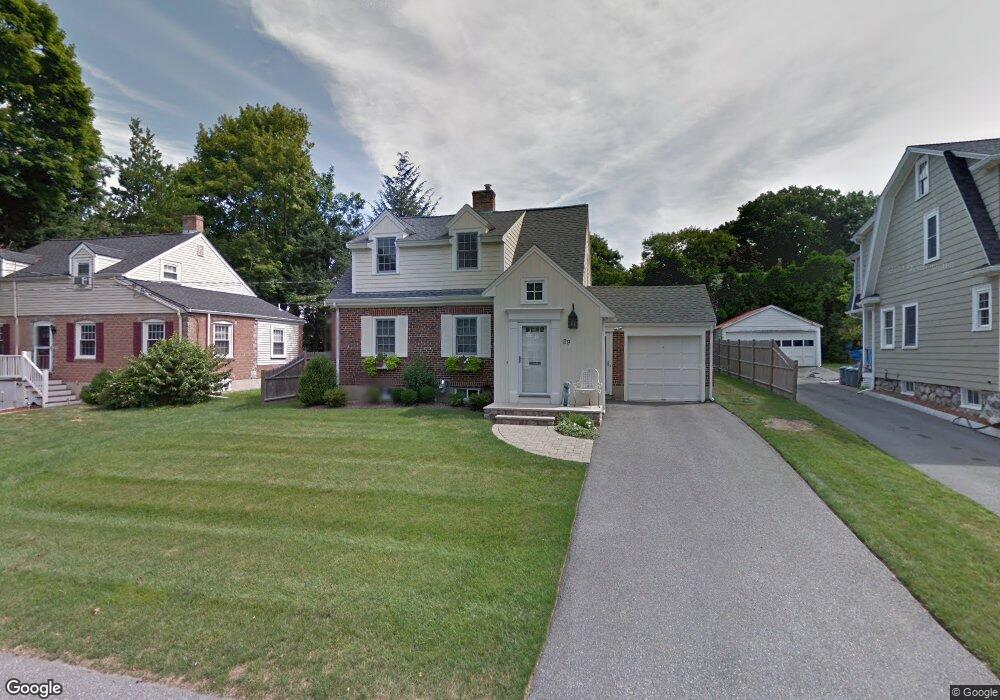
29 Harding Rd Lexington, MA 02420
North Lexington NeighborhoodEstimated Value: $1,075,468 - $1,134,000
2
Beds
2
Baths
1,376
Sq Ft
$812/Sq Ft
Est. Value
About This Home
This home is located at 29 Harding Rd, Lexington, MA 02420 and is currently estimated at $1,117,367, approximately $812 per square foot. 29 Harding Rd is a home located in Middlesex County with nearby schools including Joseph Estabrook Elementary School, William Diamond Middle School, and Lexington High School.
Ownership History
Date
Name
Owned For
Owner Type
Purchase Details
Closed on
May 19, 1997
Sold by
Markiewicz Robert and Markiewicz Leona
Bought by
Vento Sandra M
Current Estimated Value
Home Financials for this Owner
Home Financials are based on the most recent Mortgage that was taken out on this home.
Original Mortgage
$159,000
Interest Rate
8.12%
Mortgage Type
Purchase Money Mortgage
Purchase Details
Closed on
Nov 15, 1989
Sold by
Kozlowski Walter J
Bought by
Markiewicz Robt
Home Financials for this Owner
Home Financials are based on the most recent Mortgage that was taken out on this home.
Original Mortgage
$70,000
Interest Rate
9.97%
Mortgage Type
Purchase Money Mortgage
Create a Home Valuation Report for This Property
The Home Valuation Report is an in-depth analysis detailing your home's value as well as a comparison with similar homes in the area
Home Values in the Area
Average Home Value in this Area
Purchase History
| Date | Buyer | Sale Price | Title Company |
|---|---|---|---|
| Vento Sandra M | $259,000 | -- | |
| Markiewicz Robt | $217,000 | -- |
Source: Public Records
Mortgage History
| Date | Status | Borrower | Loan Amount |
|---|---|---|---|
| Open | Markiewicz Robt | $150,000 | |
| Closed | Markiewicz Robt | $159,000 | |
| Closed | Markiewicz Robt | $159,000 | |
| Previous Owner | Markiewicz Robt | $70,000 |
Source: Public Records
Tax History Compared to Growth
Tax History
| Year | Tax Paid | Tax Assessment Tax Assessment Total Assessment is a certain percentage of the fair market value that is determined by local assessors to be the total taxable value of land and additions on the property. | Land | Improvement |
|---|---|---|---|---|
| 2025 | $12,964 | $1,060,000 | $774,000 | $286,000 |
| 2024 | $12,520 | $1,022,000 | $737,000 | $285,000 |
| 2023 | $11,999 | $923,000 | $670,000 | $253,000 |
| 2022 | $11,523 | $835,000 | $609,000 | $226,000 |
| 2021 | $11,152 | $775,000 | $556,000 | $219,000 |
| 2020 | $10,889 | $775,000 | $556,000 | $219,000 |
| 2019 | $10,364 | $734,000 | $529,000 | $205,000 |
| 2018 | $9,853 | $689,000 | $504,000 | $185,000 |
| 2017 | $10,013 | $691,000 | $493,000 | $198,000 |
| 2016 | $9,125 | $625,000 | $449,000 | $176,000 |
| 2015 | $8,678 | $584,000 | $408,000 | $176,000 |
| 2014 | $7,662 | $494,000 | $371,000 | $123,000 |
Source: Public Records
Map
Nearby Homes
- 3a Nowers Rd
- 103 N Hancock St
- 17 Hamilton Rd
- 24 Vaille Ave
- 101 Burlington St
- 25 Flintlock Rd
- 18 Robinson Rd
- 125 Burlington St
- 6 Hadley Rd
- 93 Bedford St Unit 201
- 93 Bedford St Unit 308
- 93 Bedford St Unit 101
- 12 Coolidge Ave
- 36 Adams St
- 45 Hancock St
- 21 Balfour St
- 92 Hill St
- 46 Asbury St
- 75 Westview St
- 18 Greenwood St