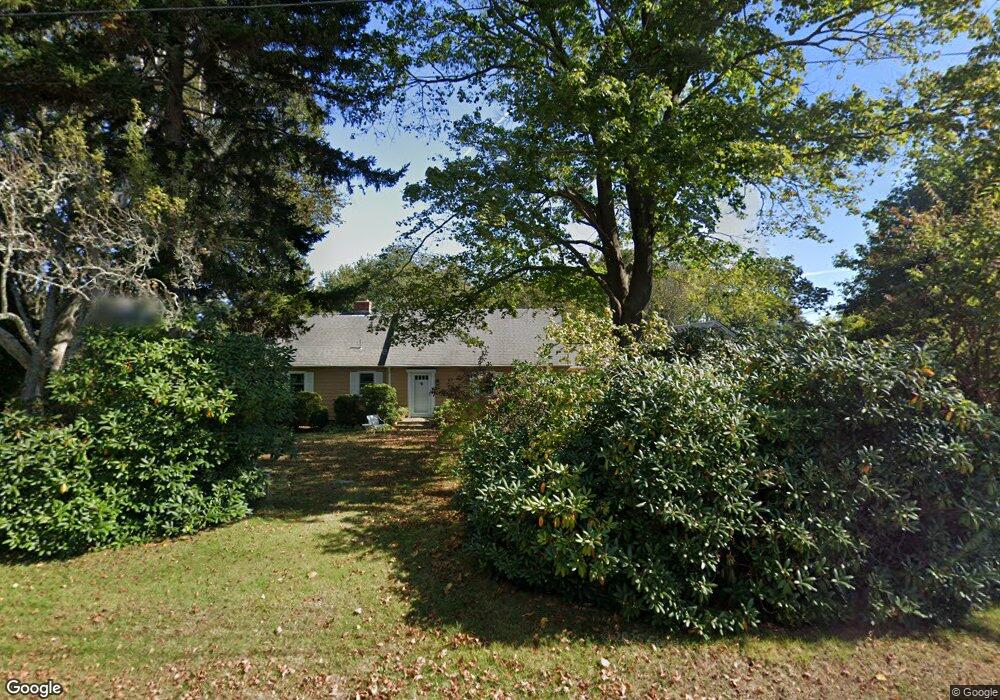
29 Hillside Ave Groton, CT 06340
Noank NeighborhoodEstimated Value: $585,236 - $946,000
3
Beds
2
Baths
2,480
Sq Ft
$300/Sq Ft
Est. Value
About This Home
This home is located at 29 Hillside Ave, Groton, CT 06340 and is currently estimated at $743,059, approximately $299 per square foot. 29 Hillside Ave is a home located in New London County with nearby schools including Groton Middle School and Robert E. Fitch High School.
Ownership History
Date
Name
Owned For
Owner Type
Purchase Details
Closed on
Sep 3, 2025
Sold by
Hutson James E and Hutson Miriam H
Bought by
James E Hutson Jr Ret and Hutson
Current Estimated Value
Purchase Details
Closed on
Sep 26, 1994
Sold by
Nickrash Michael C and Nickrash Rita
Bought by
Hutson James and Hutson Miriam
Home Financials for this Owner
Home Financials are based on the most recent Mortgage that was taken out on this home.
Original Mortgage
$143,800
Interest Rate
5.75%
Mortgage Type
Purchase Money Mortgage
Create a Home Valuation Report for This Property
The Home Valuation Report is an in-depth analysis detailing your home's value as well as a comparison with similar homes in the area
Home Values in the Area
Average Home Value in this Area
Purchase History
| Date | Buyer | Sale Price | Title Company |
|---|---|---|---|
| James E Hutson Jr Ret | -- | -- | |
| Hutson James | $151,000 | -- |
Source: Public Records
Mortgage History
| Date | Status | Borrower | Loan Amount |
|---|---|---|---|
| Previous Owner | Hutson James | $52,000 | |
| Previous Owner | Hutson James | $41,000 | |
| Previous Owner | Hutson James | $143,800 |
Source: Public Records
Tax History
| Year | Tax Paid | Tax Assessment Tax Assessment Total Assessment is a certain percentage of the fair market value that is determined by local assessors to be the total taxable value of land and additions on the property. | Land | Improvement |
|---|---|---|---|---|
| 2025 | $7,041 | $266,910 | $144,214 | $122,696 |
| 2024 | $6,574 | $266,910 | $144,214 | $122,696 |
| 2023 | $6,302 | $266,910 | $91,630 | $175,280 |
| 2022 | $6,174 | $266,910 | $91,630 | $175,280 |
| 2021 | $5,902 | $213,360 | $67,900 | $145,460 |
| 2020 | $5,750 | $213,360 | $67,900 | $145,460 |
| 2019 | $5,490 | $213,360 | $67,900 | $145,460 |
| 2018 | $5,453 | $213,360 | $67,900 | $145,460 |
| 2017 | $5,360 | $213,360 | $67,900 | $145,460 |
| 2016 | $5,499 | $236,810 | $101,150 | $135,660 |
| 2015 | $5,290 | $236,810 | $101,150 | $135,660 |
| 2014 | $5,155 | $236,810 | $101,150 | $135,660 |
Source: Public Records
Map
Nearby Homes
Your Personal Tour Guide
Ask me questions while you tour the home.