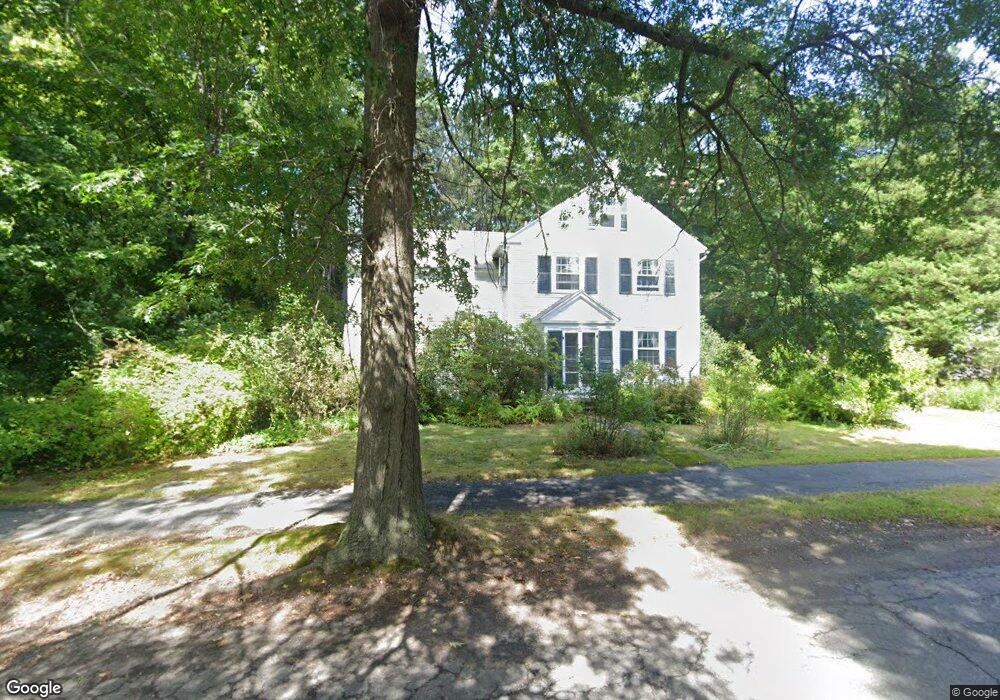
29 Hitchcock Rd Amherst, MA 01002
Estimated Value: $579,000 - $797,000
4
Beds
3
Baths
3,109
Sq Ft
$238/Sq Ft
Est. Value
About This Home
This home is located at 29 Hitchcock Rd, Amherst, MA 01002 and is currently estimated at $739,574, approximately $237 per square foot. 29 Hitchcock Rd is a home located in Hampshire County with nearby schools including Crocker Farm Elementary School, Amherst Regional Middle School, and Amherst Regional High School.
Ownership History
Date
Name
Owned For
Owner Type
Purchase Details
Closed on
Nov 13, 1998
Sold by
Amherst College
Bought by
Sinos Dale and Sinos Rebecca H
Current Estimated Value
Home Financials for this Owner
Home Financials are based on the most recent Mortgage that was taken out on this home.
Original Mortgage
$149,500
Outstanding Balance
$32,804
Interest Rate
6.65%
Mortgage Type
Purchase Money Mortgage
Estimated Equity
$706,770
Create a Home Valuation Report for This Property
The Home Valuation Report is an in-depth analysis detailing your home's value as well as a comparison with similar homes in the area
Home Values in the Area
Average Home Value in this Area
Purchase History
| Date | Buyer | Sale Price | Title Company |
|---|---|---|---|
| Sinos Dale | $149,500 | -- |
Source: Public Records
Mortgage History
| Date | Status | Borrower | Loan Amount |
|---|---|---|---|
| Open | Sinos Dale | $149,500 |
Source: Public Records
Tax History Compared to Growth
Tax History
| Year | Tax Paid | Tax Assessment Tax Assessment Total Assessment is a certain percentage of the fair market value that is determined by local assessors to be the total taxable value of land and additions on the property. | Land | Improvement |
|---|---|---|---|---|
| 2025 | $125 | $696,000 | $202,300 | $493,700 |
| 2024 | $12,181 | $658,100 | $190,800 | $467,300 |
| 2023 | $11,525 | $573,400 | $173,400 | $400,000 |
| 2022 | $11,133 | $523,400 | $157,700 | $365,700 |
| 2021 | $10,591 | $485,400 | $146,100 | $339,300 |
| 2020 | $10,349 | $485,400 | $146,100 | $339,300 |
| 2019 | $9,950 | $456,400 | $146,100 | $310,300 |
| 2018 | $9,648 | $456,400 | $146,100 | $310,300 |
| 2017 | $10,216 | $468,000 | $139,100 | $328,900 |
| 2016 | $9,931 | $468,000 | $139,100 | $328,900 |
| 2015 | $9,613 | $468,000 | $139,100 | $328,900 |
Source: Public Records
Map
Nearby Homes
- 18 N Prospect St
- 65 N Prospect St
- 48 Gray St
- 26 Greenleaves Dr Unit 620
- 161 Chestnut St
- 0 Red Gate Ln Unit 73348273
- 170 E Hadley Rd Unit 123
- 170 E Hadley Rd Unit 46
- 265 Stanley St
- 305 Strong St
- 481 Old Farm Rd
- 53 Pine Grove Unit 53
- 328 Russell St
- 0 W Pomeroy Ln
- 88 Farview Way
- 96 Logtown Rd
- 500 West St Unit 6
- 57 Tanglewood Rd
- 0 Heatherstone Rd
- 324 Pomeroy Ln
- 100 Woodside Ave
- 43 Hitchcock Rd
- 32 Hitchcock Rd
- 88 Woodside Ave
- 263 S Pleasant St
- 78 Woodside Ave
- 87 Woodside Ave
- 62 Orchard St
- 72 Woodside Ave
- 66 Woodside Ave
- 46 Orchard St
- 46 Snell St
- 71 Woodside Ave
- 317 S Pleasant St
- 40 Orchard St
- 54 Snell St
- 227 S Pleasant St
- 147 Woodside Ave
- 57 Woodside Ave
- 30 Orchard St