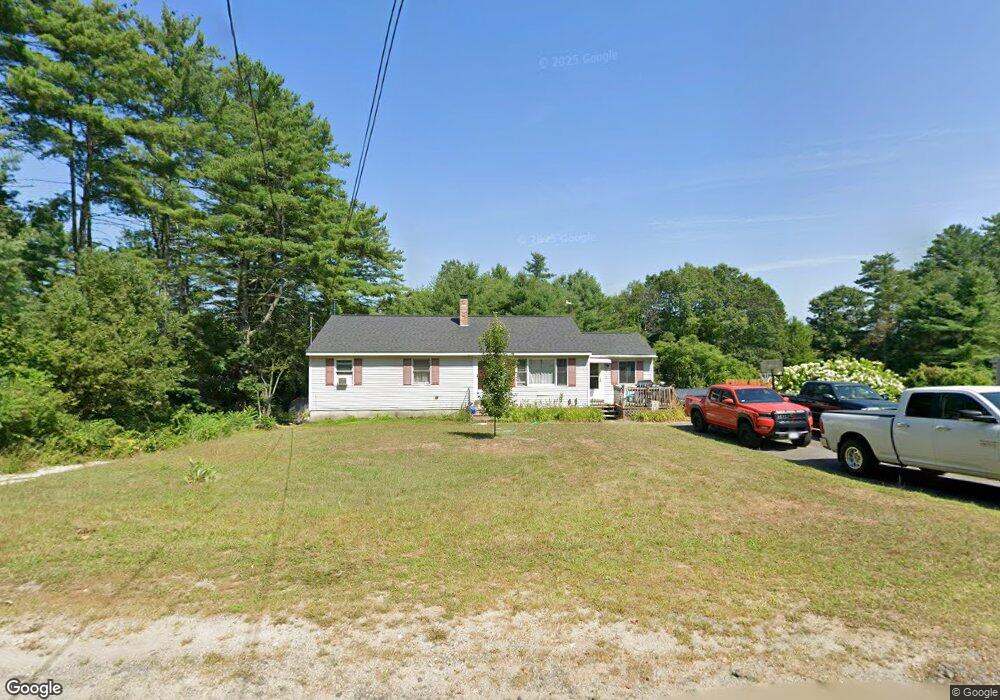
29 Johnson Rd Orange, MA 01364
Estimated Value: $281,000 - $342,000
3
Beds
2
Baths
1,176
Sq Ft
$270/Sq Ft
Est. Value
About This Home
This home is located at 29 Johnson Rd, Orange, MA 01364 and is currently estimated at $317,621, approximately $270 per square foot. 29 Johnson Rd is a home located in Franklin County with nearby schools including Fisher Hill and Ralph C Mahar Regional School.
Ownership History
Date
Name
Owned For
Owner Type
Purchase Details
Closed on
Oct 26, 2006
Sold by
Fisher Cheryl A
Bought by
Fisher Dalton A and Fisher Angela M
Current Estimated Value
Home Financials for this Owner
Home Financials are based on the most recent Mortgage that was taken out on this home.
Original Mortgage
$170,000
Outstanding Balance
$99,974
Interest Rate
6.48%
Mortgage Type
Purchase Money Mortgage
Estimated Equity
$217,647
Purchase Details
Closed on
Feb 15, 1994
Sold by
Mclaughlin Jon C
Bought by
Fisher Dalton A and Fisher Cheryl A
Home Financials for this Owner
Home Financials are based on the most recent Mortgage that was taken out on this home.
Original Mortgage
$73,000
Interest Rate
7.08%
Mortgage Type
Purchase Money Mortgage
Create a Home Valuation Report for This Property
The Home Valuation Report is an in-depth analysis detailing your home's value as well as a comparison with similar homes in the area
Home Values in the Area
Average Home Value in this Area
Purchase History
| Date | Buyer | Sale Price | Title Company |
|---|---|---|---|
| Fisher Dalton A | $170,000 | -- | |
| Fisher Dalton A | $92,000 | -- |
Source: Public Records
Mortgage History
| Date | Status | Borrower | Loan Amount |
|---|---|---|---|
| Open | Fisher Dalton A | $170,000 | |
| Previous Owner | Fisher Dalton A | $77,500 | |
| Previous Owner | Fisher Dalton A | $73,600 | |
| Previous Owner | Fisher Dalton A | $73,000 | |
| Closed | Fisher Dalton A | $6,000 |
Source: Public Records
Tax History
| Year | Tax Paid | Tax Assessment Tax Assessment Total Assessment is a certain percentage of the fair market value that is determined by local assessors to be the total taxable value of land and additions on the property. | Land | Improvement |
|---|---|---|---|---|
| 2025 | $47 | $283,800 | $31,900 | $251,900 |
| 2024 | $4,414 | $253,100 | $31,900 | $221,200 |
| 2023 | $4,253 | $236,800 | $31,900 | $204,900 |
| 2022 | $3,975 | $207,900 | $31,900 | $176,000 |
| 2021 | $3,691 | $184,100 | $48,600 | $135,500 |
| 2020 | $3,627 | $178,400 | $48,200 | $130,200 |
| 2019 | $3,308 | $146,900 | $42,000 | $104,900 |
| 2018 | $3,102 | $141,400 | $39,100 | $102,300 |
| 2017 | $3,002 | $141,400 | $39,100 | $102,300 |
| 2016 | $3,027 | $139,500 | $39,100 | $100,400 |
| 2015 | $2,866 | $138,000 | $39,100 | $98,900 |
| 2014 | $2,793 | $141,500 | $39,100 | $102,400 |
Source: Public Records
Map
Nearby Homes
Your Personal Tour Guide
Ask me questions while you tour the home.