Estimated Value: $455,000 - $532,000
2
Beds
1
Bath
924
Sq Ft
$516/Sq Ft
Est. Value
About This Home
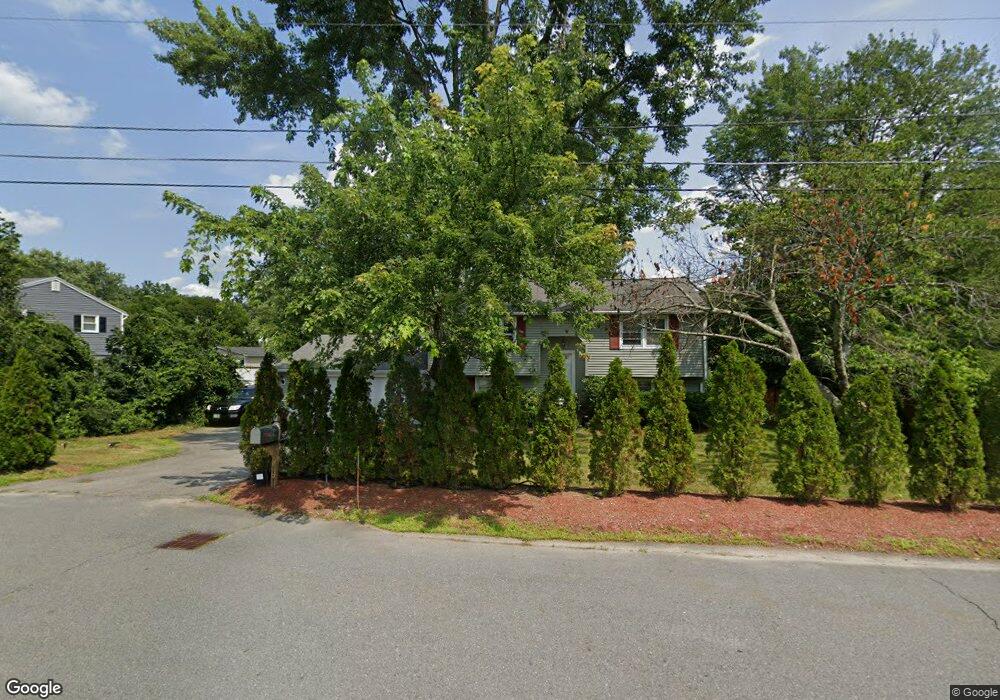
This home is located at 29 Joseph Rd, Salem, NH 03079 and is currently estimated at $476,951, approximately $516 per square foot. 29 Joseph Rd is a home located in Rockingham County with nearby schools including Mary A. Fisk Elementary School, Woodbury School, and Salem High School.
Ownership History
Date
Name
Owned For
Owner Type
Purchase Details
Closed on
Aug 26, 1999
Sold by
Seidel Roger C and Seidel Pamela A
Bought by
Golden James P and Golden Motoko H
Current Estimated Value
Home Financials for this Owner
Home Financials are based on the most recent Mortgage that was taken out on this home.
Original Mortgage
$125,600
Outstanding Balance
$36,407
Interest Rate
7.53%
Mortgage Type
Purchase Money Mortgage
Estimated Equity
$440,544
Create a Home Valuation Report for This Property
The Home Valuation Report is an in-depth analysis detailing your home's value as well as a comparison with similar homes in the area
Purchase History
| Date | Buyer | Sale Price | Title Company |
|---|---|---|---|
| Golden James P | $157,000 | -- |
Source: Public Records
Mortgage History
| Date | Status | Borrower | Loan Amount |
|---|---|---|---|
| Open | Golden James P | $125,600 |
Source: Public Records
Tax History
| Year | Tax Paid | Tax Assessment Tax Assessment Total Assessment is a certain percentage of the fair market value that is determined by local assessors to be the total taxable value of land and additions on the property. | Land | Improvement |
|---|---|---|---|---|
| 2024 | $6,621 | $376,200 | $155,900 | $220,300 |
| 2023 | $6,380 | $376,200 | $155,900 | $220,300 |
| 2022 | $6,038 | $376,200 | $155,900 | $220,300 |
| 2021 | $6,012 | $376,200 | $155,900 | $220,300 |
| 2020 | $5,368 | $243,800 | $111,200 | $132,600 |
| 2019 | $5,359 | $243,800 | $111,200 | $132,600 |
| 2018 | $5,269 | $243,800 | $111,200 | $132,600 |
| 2017 | $5,081 | $243,800 | $111,200 | $132,600 |
| 2016 | $4,981 | $243,800 | $111,200 | $132,600 |
| 2015 | $4,883 | $228,300 | $116,400 | $111,900 |
| 2014 | $4,746 | $228,300 | $116,400 | $111,900 |
| 2013 | $4,522 | $221,000 | $116,400 | $104,600 |
Source: Public Records
Map
Nearby Homes
- 7 Therese Rd
- 42 Marianna Rd
- 30 Main St
- 47 Millville St
- 144 N Policy St
- 10 Millville St
- 64 Lake St
- 4 Therriault Ave
- 15 Briar Ave
- 100 School St
- 8 Alta Ave
- 66 Brookwood Dr
- 12 Field Ave
- 14 Loren Rd
- 2 Muse Terrace
- 18 Artisan Dr Unit 307
- 18 Artisan Dr Unit 401
- 18 Artisan Dr Unit 505
- 18 Artisan Dr Unit 207
- 18 Artisan Dr Unit 217
Your Personal Tour Guide
Ask me questions while you tour the home.