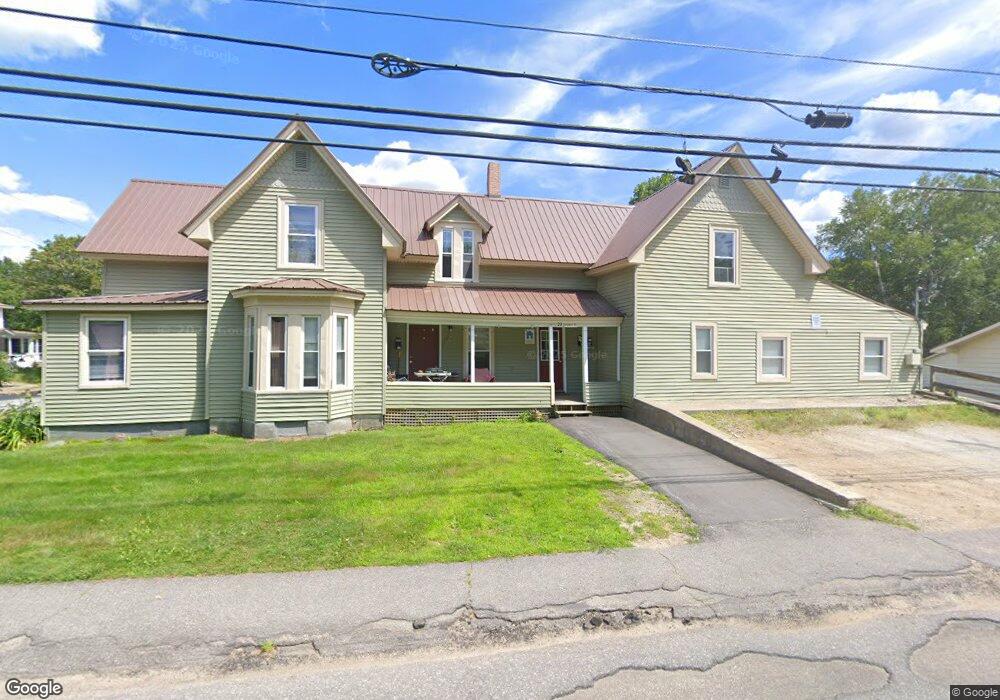
29 Langdon St Plymouth, NH 03264
Estimated Value: $386,000 - $813,547
11
Beds
4
Baths
2,668
Sq Ft
$202/Sq Ft
Est. Value
About This Home
This home is located at 29 Langdon St, Plymouth, NH 03264 and is currently estimated at $538,637, approximately $201 per square foot. 29 Langdon St is a home located in Grafton County with nearby schools including Plymouth Elementary School, Plymouth Regional High School, and Plymouth State University CD & FC.
Ownership History
Date
Name
Owned For
Owner Type
Purchase Details
Closed on
Jun 5, 2015
Sold by
Sdev Llc
Bought by
Psu 1 Llc
Current Estimated Value
Purchase Details
Closed on
Aug 31, 2005
Sold by
Lalley Sean P and Lalley Margo M
Bought by
Caron Jeffrey S
Home Financials for this Owner
Home Financials are based on the most recent Mortgage that was taken out on this home.
Original Mortgage
$153,000
Interest Rate
5.81%
Create a Home Valuation Report for This Property
The Home Valuation Report is an in-depth analysis detailing your home's value as well as a comparison with similar homes in the area
Home Values in the Area
Average Home Value in this Area
Purchase History
| Date | Buyer | Sale Price | Title Company |
|---|---|---|---|
| Psu 1 Llc | $350,533 | -- | |
| Caron Jeffrey S | $170,000 | -- | |
| Caron Jeffrey S | $170,000 | -- |
Source: Public Records
Mortgage History
| Date | Status | Borrower | Loan Amount |
|---|---|---|---|
| Previous Owner | Caron Jeffrey S | $153,000 | |
| Previous Owner | Caron Jeffrey S | $140,000 |
Source: Public Records
Tax History Compared to Growth
Tax History
| Year | Tax Paid | Tax Assessment Tax Assessment Total Assessment is a certain percentage of the fair market value that is determined by local assessors to be the total taxable value of land and additions on the property. | Land | Improvement |
|---|---|---|---|---|
| 2024 | $9,400 | $374,200 | $94,700 | $279,500 |
| 2023 | $9,123 | $374,200 | $94,700 | $279,500 |
| 2022 | $10,042 | $319,400 | $47,900 | $271,500 |
| 2021 | $9,739 | $319,400 | $47,900 | $271,500 |
| 2020 | $9,100 | $319,400 | $47,900 | $271,500 |
| 2019 | $9,004 | $319,400 | $47,900 | $271,500 |
| 2018 | $8,081 | $319,400 | $47,900 | $271,500 |
| 2017 | $6,802 | $230,100 | $43,900 | $186,200 |
| 2016 | $5,792 | $230,100 | $43,900 | $186,200 |
| 2015 | $5,624 | $230,100 | $43,900 | $186,200 |
| 2014 | $5,451 | $227,800 | $43,900 | $183,900 |
| 2013 | $5,474 | $227,800 | $43,900 | $183,900 |
Source: Public Records
Map
Nearby Homes
- 25 Wentworth St
- 28, 29 &42 Railroad & Main Square
- 10 Hawthorne St
- 12 Broadway St
- 75 Pleasant St
- 6 Boe Rd
- 0 Binks Hill Rd
- 0 Oak Ridge Rd Unit 27
- 9 Blueberry Hill Rd Unit 8
- 18 Wildflower Ln Unit 208-97-8-01
- 72 Crescent St
- 20 Wildflower Ln Unit 208-97-9-2
- 20 Wildflower Ln Unit 208-97-9-1
- 263 Highland St
- 14 Heritage Hill Rd
- 29 Reservoir Heights Rd
- 585 N Ashland Rd
- 96 Fairway Dr Unit 1
- 64 Fairway Dr
- 193 New Hebron Rd