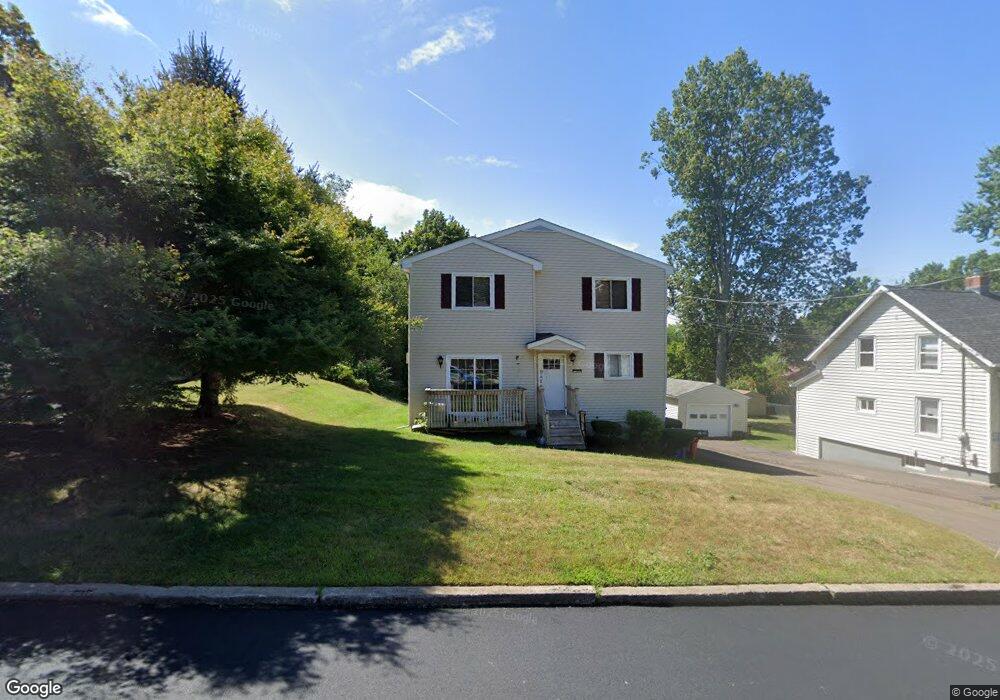
29 Lima St Unit A Meriden, CT 06450
Estimated Value: $174,000 - $199,000
2
Beds
2
Baths
988
Sq Ft
$188/Sq Ft
Est. Value
About This Home
This home is located at 29 Lima St Unit A, Meriden, CT 06450 and is currently estimated at $185,804, approximately $188 per square foot. 29 Lima St Unit A is a home located in New Haven County with nearby schools including Casimir Pulaski School, Washington Middle School, and Francis T. Maloney High School.
Ownership History
Date
Name
Owned For
Owner Type
Purchase Details
Closed on
Aug 30, 2002
Sold by
Flanagan Mark K and Flanagan Joan
Bought by
Derubio Jeanette Gil
Current Estimated Value
Home Financials for this Owner
Home Financials are based on the most recent Mortgage that was taken out on this home.
Original Mortgage
$74,900
Outstanding Balance
$31,694
Interest Rate
6.55%
Estimated Equity
$154,110
Purchase Details
Closed on
Dec 14, 1988
Sold by
Wight Norman M
Bought by
Flanagan Mark K
Home Financials for this Owner
Home Financials are based on the most recent Mortgage that was taken out on this home.
Original Mortgage
$83,900
Interest Rate
10.07%
Mortgage Type
Purchase Money Mortgage
Create a Home Valuation Report for This Property
The Home Valuation Report is an in-depth analysis detailing your home's value as well as a comparison with similar homes in the area
Home Values in the Area
Average Home Value in this Area
Purchase History
| Date | Buyer | Sale Price | Title Company |
|---|---|---|---|
| Derubio Jeanette Gil | $74,900 | -- | |
| Derubio Jeanette Gil | $74,900 | -- | |
| Flanagan Mark K | $104,900 | -- |
Source: Public Records
Mortgage History
| Date | Status | Borrower | Loan Amount |
|---|---|---|---|
| Open | Flanagan Mark K | $74,900 | |
| Closed | Flanagan Mark K | $74,900 | |
| Previous Owner | Flanagan Mark K | $83,900 |
Source: Public Records
Tax History
| Year | Tax Paid | Tax Assessment Tax Assessment Total Assessment is a certain percentage of the fair market value that is determined by local assessors to be the total taxable value of land and additions on the property. | Land | Improvement |
|---|---|---|---|---|
| 2025 | $2,356 | $62,160 | $0 | $62,160 |
| 2024 | $2,394 | $62,160 | $0 | $62,160 |
| 2023 | $2,307 | $62,160 | $0 | $62,160 |
| 2022 | $2,177 | $62,160 | $0 | $62,160 |
| 2021 | $2,374 | $54,530 | $0 | $54,530 |
| 2020 | $2,367 | $54,530 | $0 | $54,530 |
| 2019 | $2,347 | $54,530 | $0 | $54,530 |
| 2018 | $2,356 | $54,530 | $0 | $54,530 |
| 2017 | $2,294 | $54,530 | $0 | $54,530 |
| 2016 | $2,806 | $72,380 | $0 | $72,380 |
| 2015 | $2,806 | $72,380 | $0 | $72,380 |
| 2014 | $2,738 | $72,380 | $0 | $72,380 |
Source: Public Records
Map
Nearby Homes