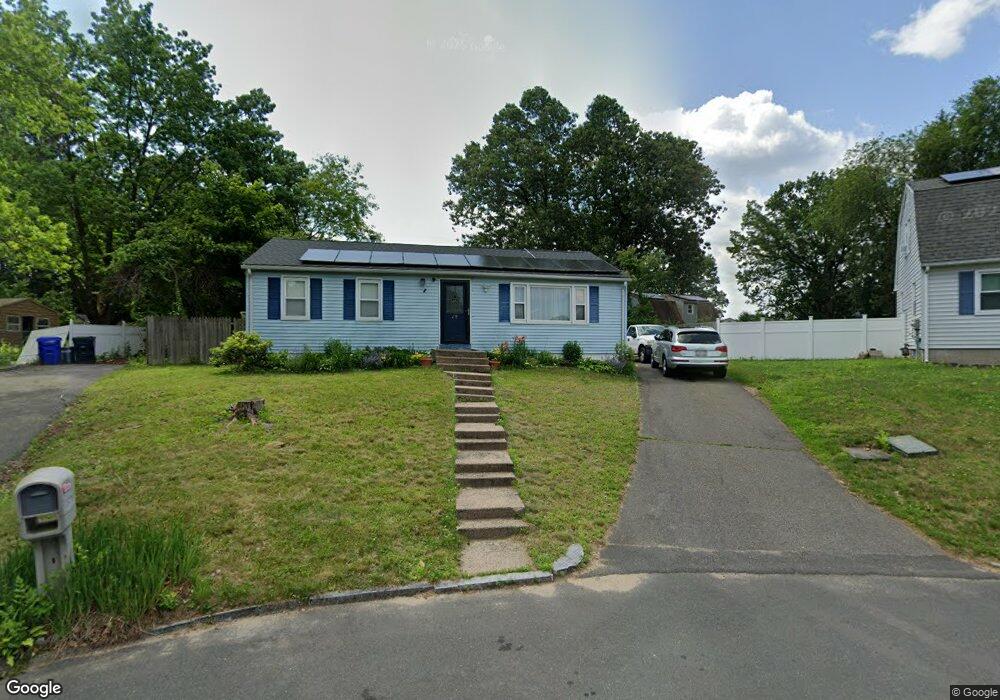
29 Lively Ln Springfield, MA 01109
Sixteen Acres NeighborhoodEstimated Value: $262,000 - $286,000
3
Beds
1
Bath
960
Sq Ft
$285/Sq Ft
Est. Value
About This Home
This home is located at 29 Lively Ln, Springfield, MA 01109 and is currently estimated at $273,181, approximately $284 per square foot. 29 Lively Ln is a home located in Hampden County with nearby schools including Frank H. Freedman School, John J Duggan Middle, and Springfield High School of Science and Technology.
Ownership History
Date
Name
Owned For
Owner Type
Purchase Details
Closed on
Jun 28, 2007
Sold by
Carmichael Roberta A
Bought by
Allen Alvin D
Current Estimated Value
Home Financials for this Owner
Home Financials are based on the most recent Mortgage that was taken out on this home.
Original Mortgage
$131,000
Interest Rate
6.24%
Mortgage Type
Purchase Money Mortgage
Purchase Details
Closed on
Sep 24, 1996
Sold by
Marks Rt and Draymore Mark R
Bought by
Carmichael Roberta A
Purchase Details
Closed on
Apr 3, 1996
Sold by
Department Of Housing & Urban Dev
Bought by
Marks Rt
Purchase Details
Closed on
Aug 9, 1995
Sold by
Washington Thomas T and Washington Pamela P
Bought by
Department Of Housing & Urban Dev
Create a Home Valuation Report for This Property
The Home Valuation Report is an in-depth analysis detailing your home's value as well as a comparison with similar homes in the area
Home Values in the Area
Average Home Value in this Area
Purchase History
| Date | Buyer | Sale Price | Title Company |
|---|---|---|---|
| Allen Alvin D | $131,000 | -- | |
| Carmichael Roberta A | $63,700 | -- | |
| Marks Rt | $44,500 | -- | |
| Department Of Housing & Urban Dev | $67,000 | -- |
Source: Public Records
Mortgage History
| Date | Status | Borrower | Loan Amount |
|---|---|---|---|
| Open | Department Of Housing & Urban Dev | $132,300 | |
| Closed | Allen Alvin D | $131,000 | |
| Previous Owner | Department Of Housing & Urban Dev | $103,250 |
Source: Public Records
Tax History Compared to Growth
Tax History
| Year | Tax Paid | Tax Assessment Tax Assessment Total Assessment is a certain percentage of the fair market value that is determined by local assessors to be the total taxable value of land and additions on the property. | Land | Improvement |
|---|---|---|---|---|
| 2025 | $3,537 | $225,600 | $51,200 | $174,400 |
| 2024 | $3,426 | $213,300 | $51,200 | $162,100 |
| 2023 | $3,309 | $194,100 | $48,700 | $145,400 |
| 2022 | $3,085 | $163,900 | $48,700 | $115,200 |
| 2021 | $3,045 | $161,100 | $44,300 | $116,800 |
| 2020 | $2,760 | $141,300 | $44,300 | $97,000 |
| 2019 | $2,686 | $136,500 | $44,300 | $92,200 |
| 2018 | $2,598 | $132,000 | $44,300 | $87,700 |
| 2017 | $2,577 | $131,100 | $48,900 | $82,200 |
| 2016 | $2,367 | $120,400 | $48,900 | $71,500 |
| 2015 | $2,358 | $119,900 | $48,900 | $71,000 |
Source: Public Records
Map
Nearby Homes
- 33 Lively Ln
- 52 Leatherleaf Cir
- 25 Lively Ln
- 48 Leatherleaf Cir
- 56 Leatherleaf Cir
- 34 Lively Ln
- 19 Lively Ln
- 57 Leatherleaf Dr
- 60 Leatherleaf Cir
- 26 Lively Ln
- 65 Leatherleaf Dr
- 53 Leatherleaf Dr
- 5 Lively Ln
- 34 Leatherleaf Cir
- 55 Leatherleaf Cir
- 10 Lively Ln
- 25 E Hill Rd
- 24 Leatherleaf Cir
- 24 Leatherleaf Dr
- 19 E Hill Rd