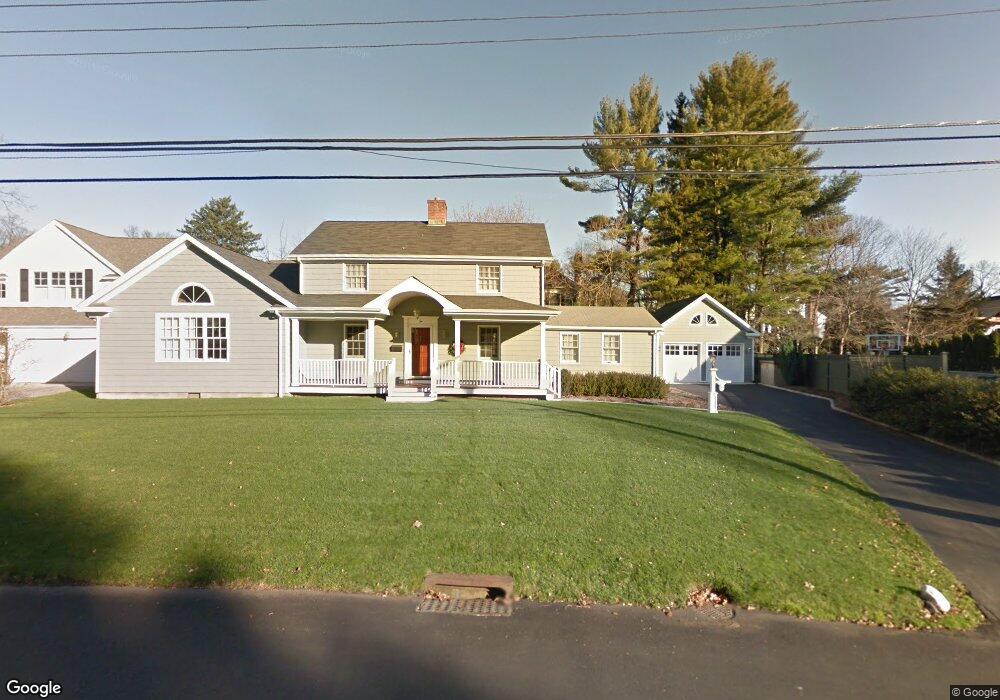
29 Lockwood Ave Old Greenwich, CT 06870
Old Greenwich NeighborhoodEstimated Value: $4,637,986 - $5,160,000
5
Beds
6
Baths
3,740
Sq Ft
$1,319/Sq Ft
Est. Value
About This Home
This home is located at 29 Lockwood Ave, Old Greenwich, CT 06870 and is currently estimated at $4,931,497, approximately $1,318 per square foot. 29 Lockwood Ave is a home located in Fairfield County with nearby schools including Old Greenwich School, Eastern Middle School, and Greenwich High School.
Ownership History
Date
Name
Owned For
Owner Type
Purchase Details
Closed on
Feb 23, 2017
Sold by
Vedbrat Supurna
Bought by
Chinai Anil
Current Estimated Value
Purchase Details
Closed on
Mar 21, 2005
Sold by
Richard Girouard Assoc
Bought by
Chinai Anil and Chinai Supurna
Home Financials for this Owner
Home Financials are based on the most recent Mortgage that was taken out on this home.
Original Mortgage
$2,480,000
Interest Rate
4.97%
Create a Home Valuation Report for This Property
The Home Valuation Report is an in-depth analysis detailing your home's value as well as a comparison with similar homes in the area
Home Values in the Area
Average Home Value in this Area
Purchase History
| Date | Buyer | Sale Price | Title Company |
|---|---|---|---|
| Chinai Anil | -- | -- | |
| Chinai Anil | $3,100,000 | -- |
Source: Public Records
Mortgage History
| Date | Status | Borrower | Loan Amount |
|---|---|---|---|
| Open | Chinai Anil | $2,100,000 | |
| Previous Owner | Chinai Anil | $2,929,000 | |
| Previous Owner | Chinai Anil | $2,929,000 | |
| Previous Owner | Chinai Anil | $2,480,000 |
Source: Public Records
Tax History Compared to Growth
Tax History
| Year | Tax Paid | Tax Assessment Tax Assessment Total Assessment is a certain percentage of the fair market value that is determined by local assessors to be the total taxable value of land and additions on the property. | Land | Improvement |
|---|---|---|---|---|
| 2025 | $26,910 | $2,177,350 | $1,036,840 | $1,140,510 |
| 2024 | $25,989 | $2,177,350 | $1,036,840 | $1,140,510 |
| 2023 | $25,266 | $2,171,400 | $1,036,840 | $1,134,560 |
| 2022 | $25,036 | $2,171,400 | $1,036,840 | $1,134,560 |
| 2021 | $26,486 | $2,199,820 | $907,340 | $1,292,480 |
| 2020 | $26,442 | $2,199,820 | $907,340 | $1,292,480 |
| 2019 | $26,238 | $2,161,320 | $907,340 | $1,253,980 |
| 2018 | $25,655 | $2,161,320 | $907,340 | $1,253,980 |
| 2017 | $25,977 | $2,161,320 | $907,340 | $1,253,980 |
| 2016 | $25,566 | $2,161,320 | $907,340 | $1,253,980 |
| 2015 | $22,300 | $1,870,050 | $992,250 | $877,800 |
| 2014 | $21,739 | $1,870,050 | $992,250 | $877,800 |
Source: Public Records
Map
Nearby Homes