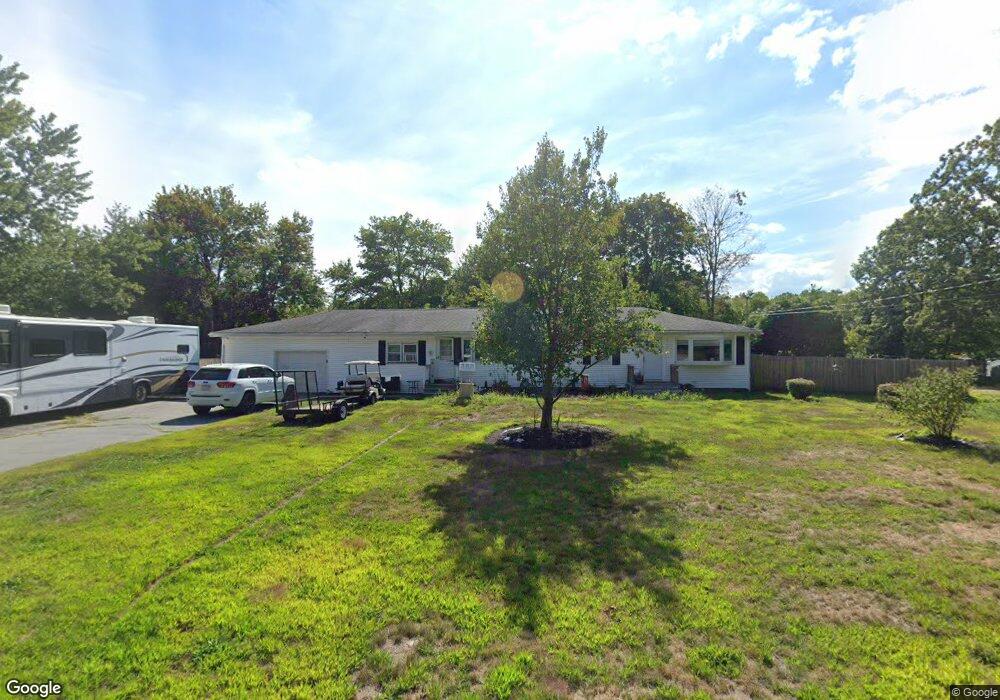
29 Locust St Berkley, MA 02779
Berkley Bridge/Lower Berkley NeighborhoodEstimated Value: $534,525 - $602,000
3
Beds
2
Baths
1,548
Sq Ft
$358/Sq Ft
Est. Value
About This Home
This home is located at 29 Locust St, Berkley, MA 02779 and is currently estimated at $553,631, approximately $357 per square foot. 29 Locust St is a home located in Bristol County with nearby schools including Berkley Community School and Our Lady of Lourdes School.
Ownership History
Date
Name
Owned For
Owner Type
Purchase Details
Closed on
Oct 19, 2018
Sold by
Frizado Linda and Frizado Ronald D
Bought by
Locust Street Realty L
Current Estimated Value
Purchase Details
Closed on
Jul 2, 2013
Sold by
Vanada Eileen C and Frizado Rose M
Bought by
Frizado Linda and Frizado Ronald D
Home Financials for this Owner
Home Financials are based on the most recent Mortgage that was taken out on this home.
Original Mortgage
$34,677
Interest Rate
3.97%
Purchase Details
Closed on
Jun 1, 2012
Sold by
Vanda Eileen C
Bought by
Frizado Rose M
Create a Home Valuation Report for This Property
The Home Valuation Report is an in-depth analysis detailing your home's value as well as a comparison with similar homes in the area
Home Values in the Area
Average Home Value in this Area
Purchase History
| Date | Buyer | Sale Price | Title Company |
|---|---|---|---|
| Locust Street Realty L | $140,000 | -- | |
| Frizado Linda | $130,000 | -- | |
| Frizado Rose M | -- | -- |
Source: Public Records
Mortgage History
| Date | Status | Borrower | Loan Amount |
|---|---|---|---|
| Previous Owner | Frizado Linda | $34,677 | |
| Previous Owner | Frizado Linda | $100,000 |
Source: Public Records
Tax History Compared to Growth
Tax History
| Year | Tax Paid | Tax Assessment Tax Assessment Total Assessment is a certain percentage of the fair market value that is determined by local assessors to be the total taxable value of land and additions on the property. | Land | Improvement |
|---|---|---|---|---|
| 2025 | $55 | $457,900 | $158,800 | $299,100 |
| 2024 | $5,243 | $421,100 | $136,800 | $284,300 |
| 2023 | $5,169 | $391,000 | $136,800 | $254,200 |
| 2022 | $5,011 | $364,400 | $118,900 | $245,500 |
| 2021 | $4,875 | $341,400 | $113,200 | $228,200 |
| 2020 | $4,875 | $335,500 | $100,200 | $235,300 |
| 2019 | $4,746 | $324,200 | $100,200 | $224,000 |
| 2018 | $4,350 | $310,300 | $96,400 | $213,900 |
| 2017 | $4,263 | $298,100 | $108,000 | $190,100 |
| 2016 | $4,127 | $278,100 | $108,000 | $170,100 |
| 2015 | $3,752 | $269,700 | $108,000 | $161,700 |
| 2014 | $3,601 | $281,100 | $117,200 | $163,900 |
Source: Public Records
Map
Nearby Homes