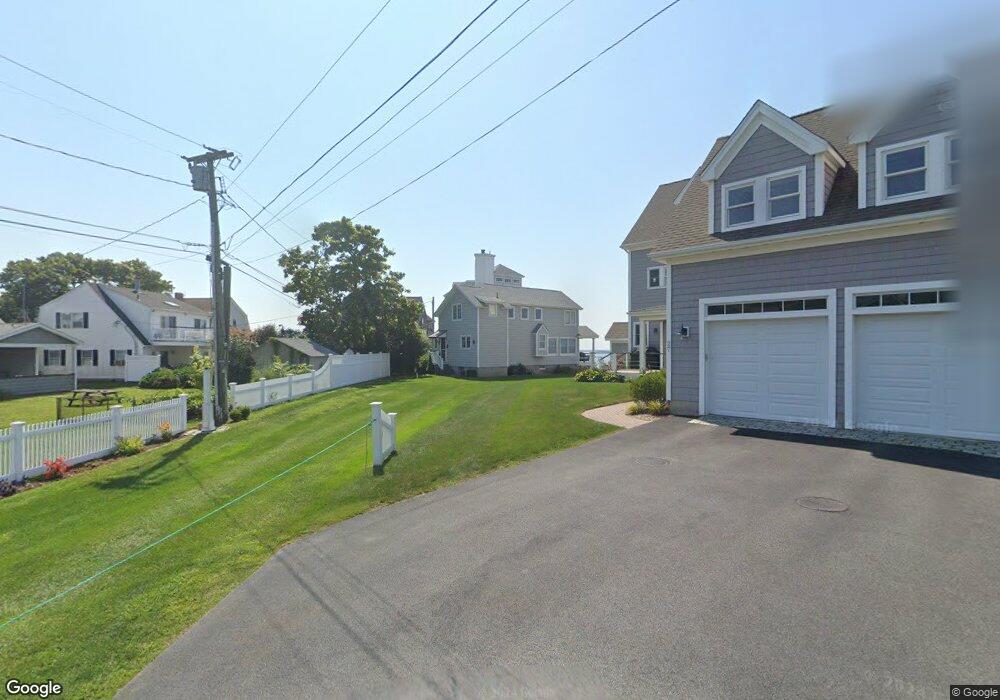
29 Loop Rd Clinton, CT 06413
Estimated Value: $1,444,000 - $2,393,000
4
Beds
3
Baths
3,111
Sq Ft
$610/Sq Ft
Est. Value
About This Home
This home is located at 29 Loop Rd, Clinton, CT 06413 and is currently estimated at $1,897,130, approximately $609 per square foot. 29 Loop Rd is a home located in Middlesex County with nearby schools including Lewin G. Joel Jr. School and The Morgan School.
Ownership History
Date
Name
Owned For
Owner Type
Purchase Details
Closed on
Dec 19, 2019
Sold by
Clark
Bought by
G
Current Estimated Value
Home Financials for this Owner
Home Financials are based on the most recent Mortgage that was taken out on this home.
Original Mortgage
$1,000,000
Outstanding Balance
$879,742
Interest Rate
3.6%
Mortgage Type
New Conventional
Estimated Equity
$1,017,388
Purchase Details
Closed on
Dec 1, 2016
Sold by
Duffy Suzanne E
Bought by
Suzanne E Duffy Ret
Purchase Details
Closed on
May 28, 1996
Sold by
Gardner Tr Elliott A and Gardner Virginia M
Bought by
Duffy Patrick and Duffy Suzanne
Home Financials for this Owner
Home Financials are based on the most recent Mortgage that was taken out on this home.
Original Mortgage
$207,000
Interest Rate
0.06%
Mortgage Type
Purchase Money Mortgage
Create a Home Valuation Report for This Property
The Home Valuation Report is an in-depth analysis detailing your home's value as well as a comparison with similar homes in the area
Home Values in the Area
Average Home Value in this Area
Purchase History
| Date | Buyer | Sale Price | Title Company |
|---|---|---|---|
| G | -- | None Available | |
| G | -- | None Available | |
| Suzanne E Duffy Ret | -- | -- | |
| Suzanne E Duffy Ret | -- | -- | |
| Duffy Patrick | $337,500 | -- | |
| Suzanne E Duffy Ret | -- | -- | |
| Duffy Patrick | $337,500 | -- |
Source: Public Records
Mortgage History
| Date | Status | Borrower | Loan Amount |
|---|---|---|---|
| Open | G | $1,000,000 | |
| Closed | G | $1,000,000 | |
| Previous Owner | Duffy Patrick | $160,000 | |
| Previous Owner | Duffy Patrick | $207,000 |
Source: Public Records
Tax History
| Year | Tax Paid | Tax Assessment Tax Assessment Total Assessment is a certain percentage of the fair market value that is determined by local assessors to be the total taxable value of land and additions on the property. | Land | Improvement |
|---|---|---|---|---|
| 2025 | $24,354 | $782,088 | $538,488 | $243,600 |
| 2024 | $23,666 | $782,088 | $538,488 | $243,600 |
| 2023 | $23,330 | $782,088 | $538,488 | $243,600 |
| 2022 | $23,330 | $782,088 | $538,488 | $243,600 |
| 2021 | $27,235 | $913,000 | $689,100 | $223,900 |
| 2020 | $28,531 | $913,000 | $689,100 | $223,900 |
| 2019 | $28,531 | $913,000 | $689,100 | $223,900 |
| 2018 | $27,883 | $913,000 | $689,100 | $223,900 |
| 2017 | $27,308 | $913,000 | $689,100 | $223,900 |
| 2016 | $24,779 | $913,000 | $689,100 | $223,900 |
| 2015 | $23,547 | $879,600 | $639,700 | $239,900 |
| 2014 | $23,107 | $879,600 | $639,700 | $239,900 |
Source: Public Records
Map
Nearby Homes
- 9 Loop Rd
- 49 + 51 Uncas Rd
- 75 Shore Rd
- 144 Shore Rd
- 167 Shore Rd
- 280 E Main St Unit E2
- 0 E Main St
- 192 E Main St
- 176 Shore Rd
- 0 Causeway
- 24 Indian Dr
- 39 Founders Village Unit 39
- 81 Founders Village Unit 81
- 296 E Main St
- 144 E Main St Unit 5
- 153 E Main St Unit 10
- 153 E Main St Unit 13
- 153 E Main St Unit 31
- 153 E Main St Unit 8
- 153 E Main St Unit 9
Your Personal Tour Guide
Ask me questions while you tour the home.