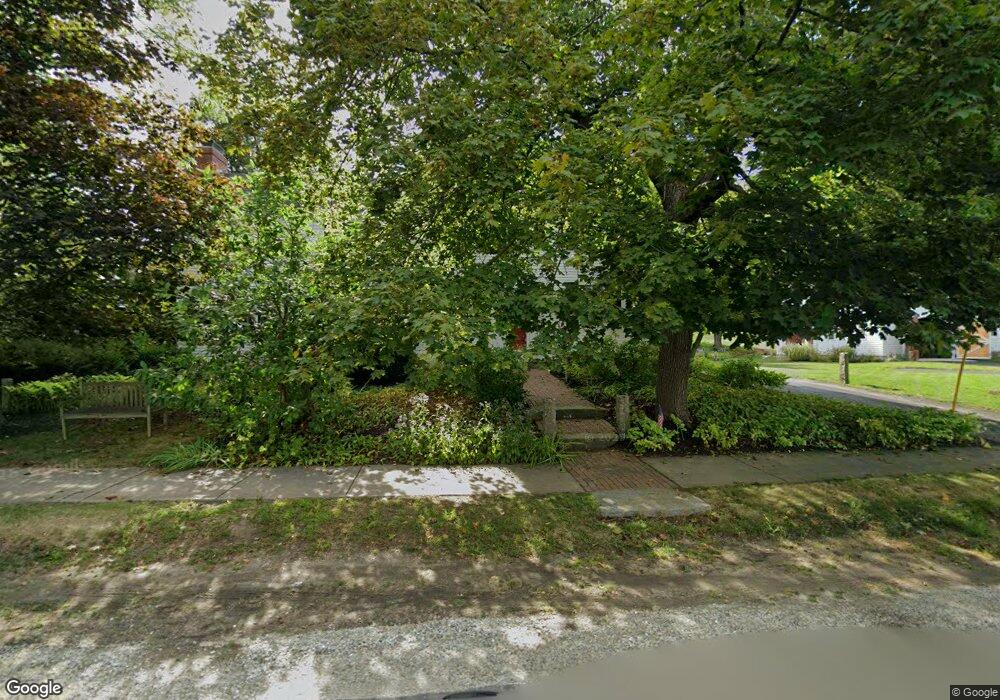
29 Main St Hollis, NH 03049
Hollis NeighborhoodEstimated Value: $979,000 - $1,237,000
4
Beds
3
Baths
4,115
Sq Ft
$256/Sq Ft
Est. Value
About This Home
This home is located at 29 Main St, Hollis, NH 03049 and is currently estimated at $1,054,608, approximately $256 per square foot. 29 Main St is a home located in Hillsborough County with nearby schools including Hollis Primary School, Hollis Upper Elementary School, and Hollis-Brookline Middle School.
Ownership History
Date
Name
Owned For
Owner Type
Purchase Details
Closed on
Nov 10, 2008
Sold by
Kaplan Mary C Vallier
Bought by
Boyd Michael C and Boyd Hannah T
Current Estimated Value
Home Financials for this Owner
Home Financials are based on the most recent Mortgage that was taken out on this home.
Original Mortgage
$417,000
Interest Rate
6.08%
Mortgage Type
Purchase Money Mortgage
Create a Home Valuation Report for This Property
The Home Valuation Report is an in-depth analysis detailing your home's value as well as a comparison with similar homes in the area
Home Values in the Area
Average Home Value in this Area
Purchase History
| Date | Buyer | Sale Price | Title Company |
|---|---|---|---|
| Boyd Michael C | $525,000 | -- |
Source: Public Records
Mortgage History
| Date | Status | Borrower | Loan Amount |
|---|---|---|---|
| Open | Boyd Michael C | $200,000 | |
| Open | Boyd Michael C | $417,000 | |
| Closed | Boyd Michael C | $417,000 | |
| Previous Owner | Boyd Michael C | $249,000 |
Source: Public Records
Tax History Compared to Growth
Tax History
| Year | Tax Paid | Tax Assessment Tax Assessment Total Assessment is a certain percentage of the fair market value that is determined by local assessors to be the total taxable value of land and additions on the property. | Land | Improvement |
|---|---|---|---|---|
| 2024 | $14,592 | $823,000 | $241,800 | $581,200 |
| 2023 | $13,400 | $804,300 | $241,800 | $562,500 |
| 2022 | $18,153 | $804,300 | $241,800 | $562,500 |
| 2021 | $13,064 | $575,500 | $154,600 | $420,900 |
| 2020 | $13,340 | $575,500 | $154,600 | $420,900 |
| 2019 | $13,294 | $575,500 | $154,600 | $420,900 |
| 2018 | $12,471 | $575,500 | $154,600 | $420,900 |
| 2017 | $11,531 | $498,100 | $134,600 | $363,500 |
| 2016 | $11,670 | $498,100 | $134,600 | $363,500 |
| 2015 | $11,466 | $498,100 | $134,600 | $363,500 |
| 2014 | $11,521 | $498,100 | $134,600 | $363,500 |
| 2013 | $11,367 | $498,100 | $134,600 | $363,500 |
Source: Public Records
Map
Nearby Homes