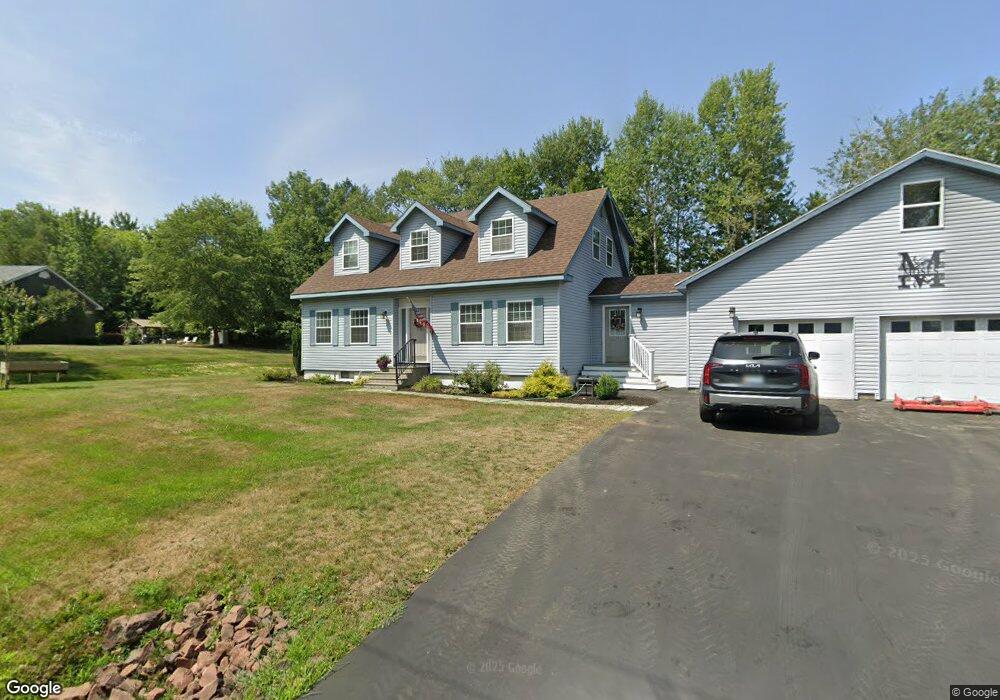
29 Manning St Calais, ME 04619
Estimated Value: $189,000 - $208,000
2
Beds
1
Bath
1,134
Sq Ft
$177/Sq Ft
Est. Value
About This Home
This home is located at 29 Manning St, Calais, ME 04619 and is currently estimated at $200,923, approximately $177 per square foot. 29 Manning St is a home with nearby schools including Calais Elementary School and Calais Middle/High School.
Ownership History
Date
Name
Owned For
Owner Type
Purchase Details
Closed on
Aug 10, 2009
Sold by
Howard 3Rd William
Bought by
Fleming Johnna L and Fleming John O
Current Estimated Value
Home Financials for this Owner
Home Financials are based on the most recent Mortgage that was taken out on this home.
Original Mortgage
$60,013
Outstanding Balance
$44,277
Interest Rate
8%
Mortgage Type
Commercial
Estimated Equity
$156,646
Purchase Details
Closed on
Mar 13, 2007
Sold by
Mahar Carolyn J Est
Bought by
Howard 3Rd William
Home Financials for this Owner
Home Financials are based on the most recent Mortgage that was taken out on this home.
Original Mortgage
$32,000
Interest Rate
6.3%
Mortgage Type
Commercial
Create a Home Valuation Report for This Property
The Home Valuation Report is an in-depth analysis detailing your home's value as well as a comparison with similar homes in the area
Home Values in the Area
Average Home Value in this Area
Purchase History
| Date | Buyer | Sale Price | Title Company |
|---|---|---|---|
| Fleming Johnna L | -- | -- | |
| Howard 3Rd William | -- | -- |
Source: Public Records
Mortgage History
| Date | Status | Borrower | Loan Amount |
|---|---|---|---|
| Open | Fleming Johnna L | $60,013 | |
| Previous Owner | Howard 3Rd William | $32,000 |
Source: Public Records
Tax History Compared to Growth
Tax History
| Year | Tax Paid | Tax Assessment Tax Assessment Total Assessment is a certain percentage of the fair market value that is determined by local assessors to be the total taxable value of land and additions on the property. | Land | Improvement |
|---|---|---|---|---|
| 2024 | $1,889 | $125,900 | $28,500 | $97,400 |
| 2023 | $1,848 | $108,700 | $24,600 | $84,100 |
| 2022 | $1,666 | $87,700 | $19,800 | $67,900 |
| 2021 | $1,817 | $84,100 | $19,000 | $65,100 |
| 2020 | $1,822 | $72,000 | $16,300 | $55,700 |
| 2019 | $1,822 | $72,000 | $16,300 | $55,700 |
| 2018 | $1,822 | $72,000 | $16,300 | $55,700 |
| 2017 | $1,822 | $72,000 | $16,300 | $55,700 |
| 2016 | $1,822 | $72,000 | $16,300 | $55,700 |
| 2015 | $1,779 | $70,300 | $16,300 | $54,000 |
| 2014 | $1,779 | $70,300 | $16,300 | $54,000 |
| 2013 | -- | $70,300 | $16,300 | $54,000 |
Source: Public Records
Map
Nearby Homes