Estimated Value: $670,243 - $714,000
3
Beds
2
Baths
1,685
Sq Ft
$415/Sq Ft
Est. Value
About This Home
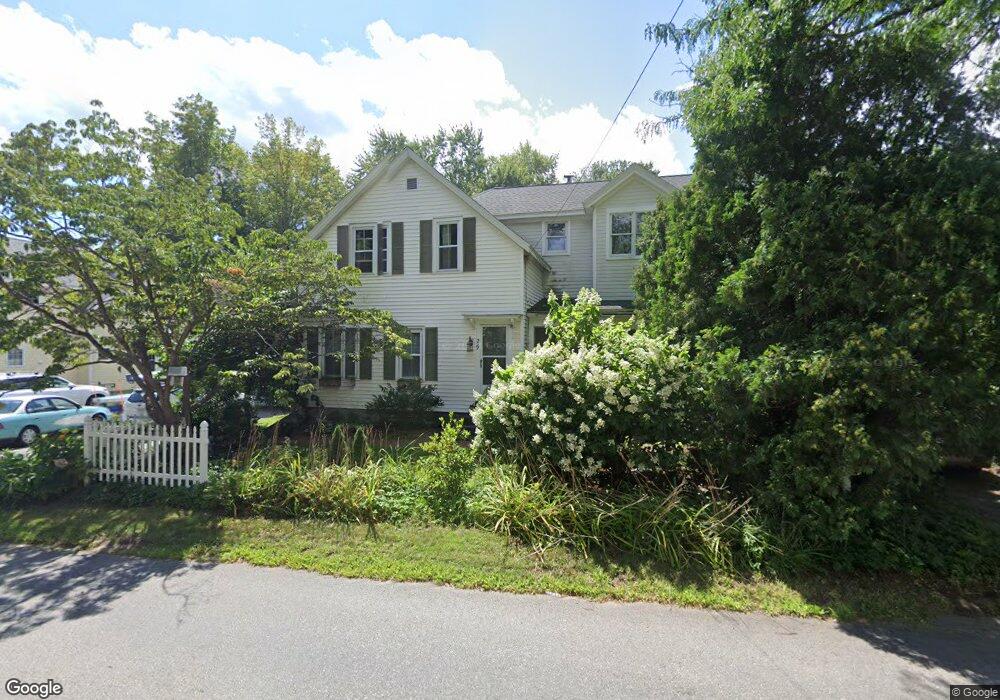
This home is located at 29 Martin St, Acton, MA 01720 and is currently estimated at $698,561, approximately $414 per square foot. 29 Martin St is a home located in Middlesex County with nearby schools including Acton-Boxborough Regional High School, Maynard Knowledge Beginnings, and The Imago School.
Ownership History
Date
Name
Owned For
Owner Type
Purchase Details
Closed on
Jul 30, 2001
Sold by
Sheehan Andrew J and Sheehan Susan A
Bought by
Morse Michael P and King Gabrielle I
Current Estimated Value
Home Financials for this Owner
Home Financials are based on the most recent Mortgage that was taken out on this home.
Original Mortgage
$236,000
Interest Rate
7.18%
Mortgage Type
Purchase Money Mortgage
Purchase Details
Closed on
Aug 30, 1990
Sold by
Bishop F Avery
Bought by
Sheehan Andrew J
Create a Home Valuation Report for This Property
The Home Valuation Report is an in-depth analysis detailing your home's value as well as a comparison with similar homes in the area
Home Values in the Area
Average Home Value in this Area
Purchase History
| Date | Buyer | Sale Price | Title Company |
|---|---|---|---|
| Morse Michael P | $295,000 | -- | |
| Sheehan Andrew J | $135,000 | -- |
Source: Public Records
Mortgage History
| Date | Status | Borrower | Loan Amount |
|---|---|---|---|
| Open | Sheehan Andrew J | $240,000 | |
| Closed | Sheehan Andrew J | $236,000 | |
| Previous Owner | Sheehan Andrew J | $100,150 |
Source: Public Records
Tax History Compared to Growth
Tax History
| Year | Tax Paid | Tax Assessment Tax Assessment Total Assessment is a certain percentage of the fair market value that is determined by local assessors to be the total taxable value of land and additions on the property. | Land | Improvement |
|---|---|---|---|---|
| 2025 | $9,134 | $532,600 | $271,300 | $261,300 |
| 2024 | $8,848 | $530,800 | $271,300 | $259,500 |
| 2023 | $8,887 | $506,100 | $246,600 | $259,500 |
| 2022 | $9,134 | $469,600 | $214,400 | $255,200 |
| 2021 | $8,242 | $407,400 | $198,400 | $209,000 |
| 2020 | $7,838 | $407,400 | $198,400 | $209,000 |
| 2019 | $7,380 | $381,000 | $198,400 | $182,600 |
| 2018 | $6,880 | $355,000 | $198,400 | $156,600 |
| 2017 | $6,766 | $355,000 | $198,400 | $156,600 |
| 2016 | $6,827 | $355,000 | $198,400 | $156,600 |
| 2015 | $6,580 | $345,400 | $198,400 | $147,000 |
| 2014 | $6,419 | $330,000 | $198,400 | $131,600 |
Source: Public Records
Map
Nearby Homes
- 19 Railroad St Unit C2
- 131 Main St
- 129 Main St Unit 129
- 129 Main St
- 169 Main St
- 4,7,8 Crestwood Ln
- 40 High St
- 86 School St
- 128 Audubon Dr
- 12 Brewster Ln
- 70 River St
- 89 Windsor Ave
- 8 Laurel Ct
- 90 Willow St Unit 1
- 92 Willow St Unit 3
- 92 Willow St Unit 2
- 3 Heather Hill Rd
- 5 Oakwood Rd
- 220 Red Acre Rd
- 285 Central St Unit 285