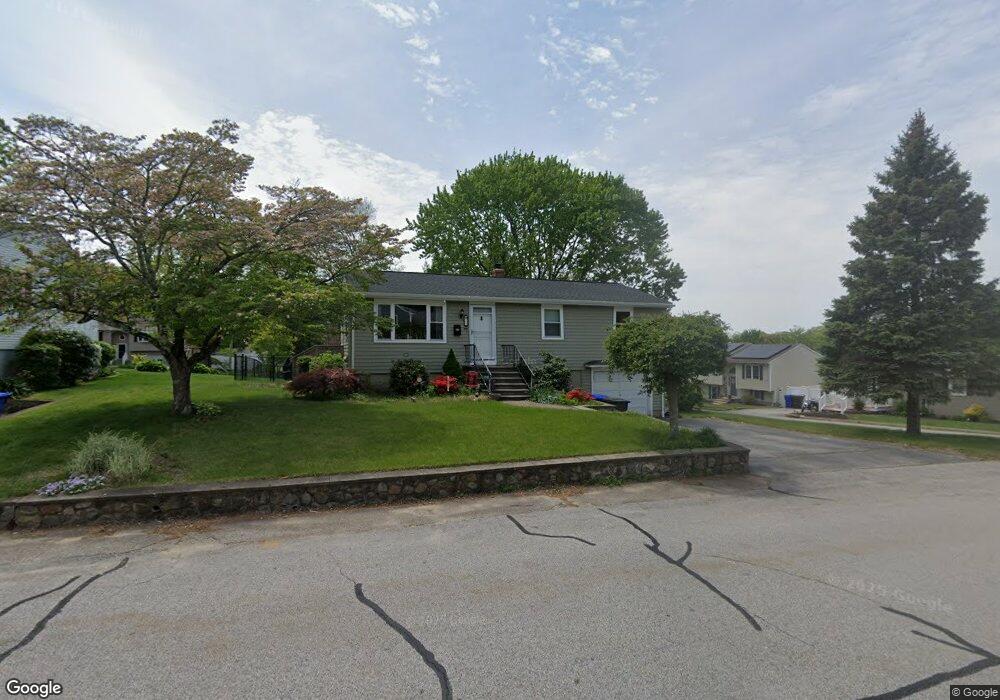
29 Mello St West Warwick, RI 02893
Lippitt-Harris NeighborhoodEstimated Value: $379,000 - $442,000
3
Beds
1
Bath
1,408
Sq Ft
$285/Sq Ft
Est. Value
About This Home
This home is located at 29 Mello St, West Warwick, RI 02893 and is currently estimated at $400,606, approximately $284 per square foot. 29 Mello St is a home located in Kent County with nearby schools including West Warwick High School, St Joseph School, and Islamic School of Rhode Island.
Ownership History
Date
Name
Owned For
Owner Type
Purchase Details
Closed on
Jan 28, 2025
Sold by
Onysko James R
Bought by
Onysko James R and Onysko Heather
Current Estimated Value
Home Financials for this Owner
Home Financials are based on the most recent Mortgage that was taken out on this home.
Original Mortgage
$195,000
Outstanding Balance
$193,828
Interest Rate
6.85%
Mortgage Type
Stand Alone Refi Refinance Of Original Loan
Estimated Equity
$206,778
Purchase Details
Closed on
Sep 17, 1997
Sold by
Marques Margaret
Bought by
Cesario Joseph E and Brown Kristen M
Home Financials for this Owner
Home Financials are based on the most recent Mortgage that was taken out on this home.
Original Mortgage
$88,900
Interest Rate
7.38%
Purchase Details
Closed on
Mar 31, 1994
Sold by
Ciccarone Anthony
Bought by
Marques Antonio and Marques Margaret
Home Financials for this Owner
Home Financials are based on the most recent Mortgage that was taken out on this home.
Original Mortgage
$63,000
Interest Rate
7.07%
Create a Home Valuation Report for This Property
The Home Valuation Report is an in-depth analysis detailing your home's value as well as a comparison with similar homes in the area
Home Values in the Area
Average Home Value in this Area
Purchase History
| Date | Buyer | Sale Price | Title Company |
|---|---|---|---|
| Onysko James R | -- | None Available | |
| Onysko James R | -- | None Available | |
| Cesario Joseph E | $89,000 | -- | |
| Cesario Joseph E | $89,000 | -- | |
| Marques Antonio | $100,000 | -- | |
| Marques Antonio | $100,000 | -- |
Source: Public Records
Mortgage History
| Date | Status | Borrower | Loan Amount |
|---|---|---|---|
| Open | Onysko James R | $195,000 | |
| Closed | Onysko James R | $195,000 | |
| Previous Owner | Marques Antonio | $117,000 | |
| Previous Owner | Marques Antonio | $88,900 | |
| Previous Owner | Marques Antonio | $63,000 |
Source: Public Records
Tax History Compared to Growth
Tax History
| Year | Tax Paid | Tax Assessment Tax Assessment Total Assessment is a certain percentage of the fair market value that is determined by local assessors to be the total taxable value of land and additions on the property. | Land | Improvement |
|---|---|---|---|---|
| 2025 | $4,611 | $322,700 | $95,900 | $226,800 |
| 2024 | $4,422 | $236,600 | $78,300 | $158,300 |
| 2023 | $4,335 | $236,600 | $78,300 | $158,300 |
| 2022 | $4,268 | $236,600 | $78,300 | $158,300 |
| 2021 | $4,110 | $178,700 | $65,900 | $112,800 |
| 2020 | $4,110 | $178,700 | $65,900 | $112,800 |
| 2019 | $5,239 | $178,700 | $65,900 | $112,800 |
| 2018 | $3,838 | $141,200 | $63,000 | $78,200 |
| 2017 | $3,715 | $141,200 | $63,000 | $78,200 |
| 2016 | $3,649 | $141,200 | $63,000 | $78,200 |
| 2015 | $3,489 | $134,400 | $63,000 | $71,400 |
| 2014 | $853 | $134,400 | $63,000 | $71,400 |
Source: Public Records
Map
Nearby Homes