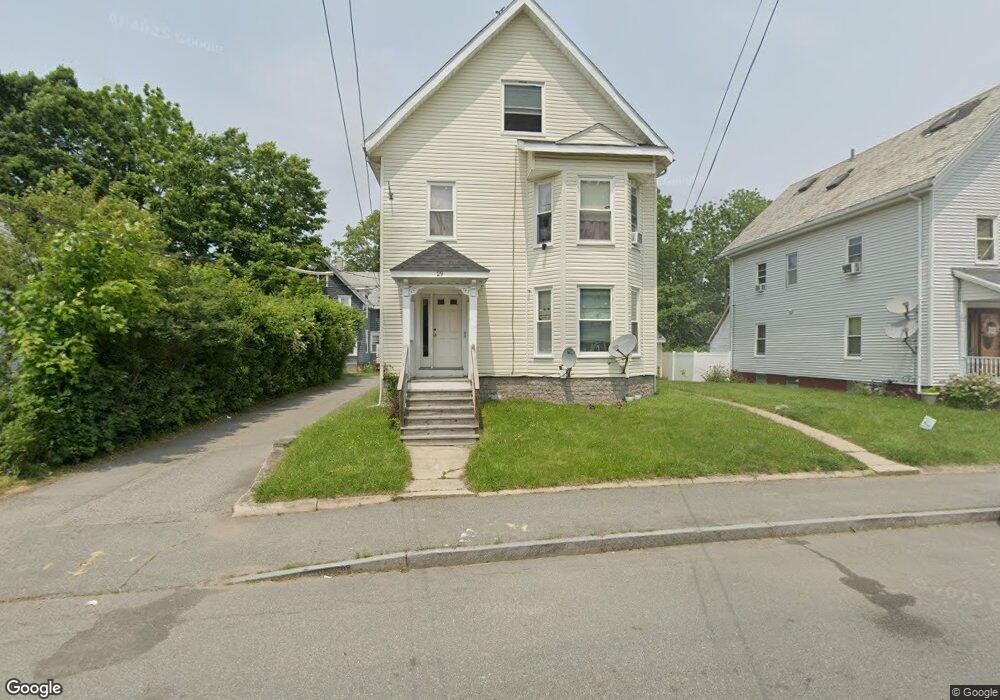
29 Menlo St Brockton, MA 02301
Clifton Heights NeighborhoodEstimated Value: $579,000 - $706,000
6
Beds
3
Baths
2,308
Sq Ft
$281/Sq Ft
Est. Value
About This Home
This home is located at 29 Menlo St, Brockton, MA 02301 and is currently estimated at $648,184, approximately $280 per square foot. 29 Menlo St is a home located in Plymouth County with nearby schools including Gilmore Elementary School, John F. Kennedy Elementary School, and Davis K-8 School.
Ownership History
Date
Name
Owned For
Owner Type
Purchase Details
Closed on
Dec 28, 2012
Sold by
Marshall Robert B and Marshall Susan
Bought by
Sbm Realty Llc
Current Estimated Value
Purchase Details
Closed on
Sep 5, 2008
Sold by
Sbm Realty Llc and Marshall
Bought by
Marshall Robert and Marshall Susan
Purchase Details
Closed on
Jun 20, 2007
Sold by
Garcia Patrick and Garcia Benjamin Nirva
Bought by
Us Bk
Purchase Details
Closed on
Nov 16, 2004
Sold by
Garcia Patrick
Bought by
Garcia Patrick and Garcia Benjamin Nirva
Purchase Details
Closed on
Nov 5, 2004
Sold by
Alfonso Maria V
Bought by
Garcia Patrick
Purchase Details
Closed on
Jun 6, 2002
Sold by
Palermo Catherine R
Bought by
Alfonso Maria V
Purchase Details
Closed on
Mar 1, 1995
Sold by
Smith Roberta E
Bought by
Palermo Catherine R
Create a Home Valuation Report for This Property
The Home Valuation Report is an in-depth analysis detailing your home's value as well as a comparison with similar homes in the area
Home Values in the Area
Average Home Value in this Area
Purchase History
| Date | Buyer | Sale Price | Title Company |
|---|---|---|---|
| Sbm Realty Llc | -- | -- | |
| Marshall Robert | -- | -- | |
| Us Bk | $340,808 | -- | |
| Garcia Patrick | -- | -- | |
| Garcia Patrick | $340,000 | -- | |
| Alfonso Maria V | $163,500 | -- | |
| Palermo Catherine R | $69,400 | -- |
Source: Public Records
Mortgage History
| Date | Status | Borrower | Loan Amount |
|---|---|---|---|
| Previous Owner | Palermo Catherine R | $2,042 |
Source: Public Records
Tax History
| Year | Tax Paid | Tax Assessment Tax Assessment Total Assessment is a certain percentage of the fair market value that is determined by local assessors to be the total taxable value of land and additions on the property. | Land | Improvement |
|---|---|---|---|---|
| 2025 | $6,681 | $551,700 | $134,800 | $416,900 |
| 2024 | $6,628 | $551,400 | $134,800 | $416,600 |
| 2023 | $5,651 | $435,400 | $101,200 | $334,200 |
| 2022 | $5,631 | $403,100 | $91,700 | $311,400 |
| 2021 | $5,261 | $362,800 | $75,700 | $287,100 |
| 2020 | $4,950 | $326,700 | $71,600 | $255,100 |
| 2019 | $5,150 | $331,400 | $68,900 | $262,500 |
| 2018 | $4,526 | $281,800 | $68,900 | $212,900 |
| 2017 | $4,213 | $261,700 | $68,900 | $192,800 |
| 2016 | $4,045 | $233,000 | $66,700 | $166,300 |
| 2015 | $3,051 | $168,100 | $66,700 | $101,400 |
| 2014 | $3,046 | $168,000 | $66,700 | $101,300 |
Source: Public Records
Map
Nearby Homes
Your Personal Tour Guide
Ask me questions while you tour the home.