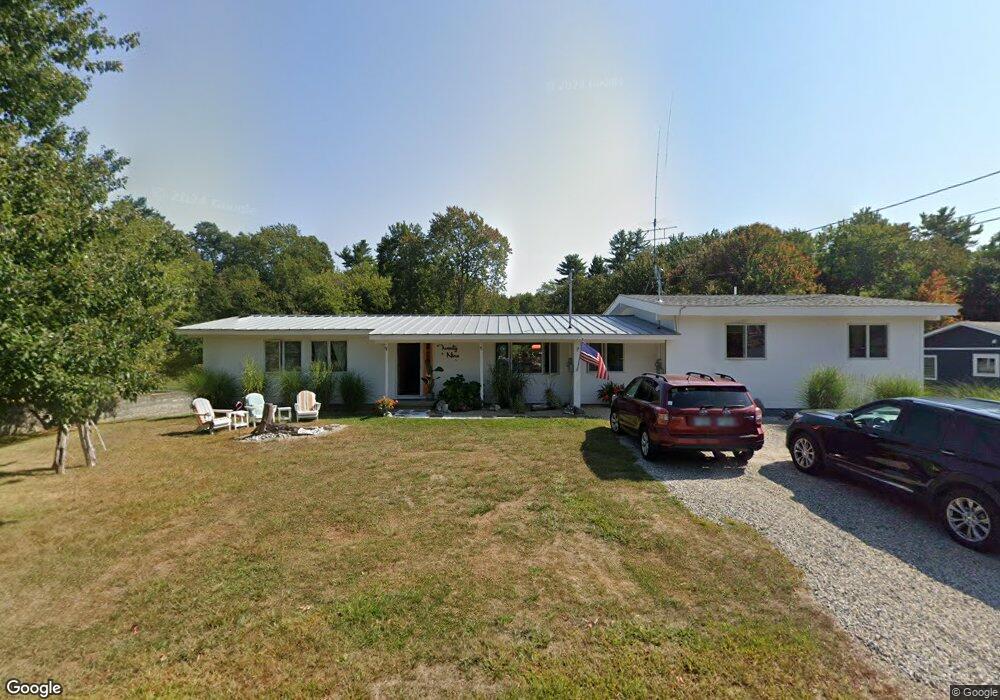
29 Mill Rd North Hampton, NH 03862
Estimated Value: $622,000 - $737,000
5
Beds
2
Baths
1,448
Sq Ft
$453/Sq Ft
Est. Value
About This Home
This home is located at 29 Mill Rd, North Hampton, NH 03862 and is currently estimated at $656,580, approximately $453 per square foot. 29 Mill Rd is a home located in Rockingham County with nearby schools including North Hampton School, Winnacunnet High School, and Sacred Heart School.
Ownership History
Date
Name
Owned For
Owner Type
Purchase Details
Closed on
Jul 5, 2016
Sold by
Adams Peter C
Bought by
Padulo Shawn and Adams Diana A
Current Estimated Value
Home Financials for this Owner
Home Financials are based on the most recent Mortgage that was taken out on this home.
Original Mortgage
$251,928
Outstanding Balance
$201,115
Interest Rate
3.58%
Mortgage Type
Purchase Money Mortgage
Estimated Equity
$455,465
Purchase Details
Closed on
Dec 4, 2007
Sold by
Preziosi Michele T
Bought by
Adams Peter C
Home Financials for this Owner
Home Financials are based on the most recent Mortgage that was taken out on this home.
Original Mortgage
$188,400
Interest Rate
6.48%
Mortgage Type
Purchase Money Mortgage
Create a Home Valuation Report for This Property
The Home Valuation Report is an in-depth analysis detailing your home's value as well as a comparison with similar homes in the area
Home Values in the Area
Average Home Value in this Area
Purchase History
| Date | Buyer | Sale Price | Title Company |
|---|---|---|---|
| Padulo Shawn | $245,000 | -- | |
| Adams Peter C | $235,500 | -- |
Source: Public Records
Mortgage History
| Date | Status | Borrower | Loan Amount |
|---|---|---|---|
| Open | Padulo Shawn | $251,928 | |
| Previous Owner | Adams Peter C | $188,400 |
Source: Public Records
Tax History
| Year | Tax Paid | Tax Assessment Tax Assessment Total Assessment is a certain percentage of the fair market value that is determined by local assessors to be the total taxable value of land and additions on the property. | Land | Improvement |
|---|---|---|---|---|
| 2024 | $5,396 | $421,600 | $206,400 | $215,200 |
| 2023 | $5,249 | $421,600 | $206,400 | $215,200 |
| 2022 | $5,421 | $315,700 | $172,000 | $143,700 |
| 2021 | $5,238 | $316,100 | $172,000 | $144,100 |
| 2020 | $5,345 | $316,100 | $172,000 | $144,100 |
| 2019 | $5,279 | $316,100 | $172,000 | $144,100 |
| 2018 | $5,040 | $316,100 | $172,000 | $144,100 |
| 2017 | $4,579 | $247,500 | $143,300 | $104,200 |
| 2016 | $7,971 | $241,500 | $143,300 | $98,200 |
| 2015 | $4,221 | $241,500 | $143,300 | $98,200 |
| 2014 | $4,118 | $241,500 | $143,300 | $98,200 |
| 2013 | $4,045 | $241,500 | $143,300 | $98,200 |
Source: Public Records
Map
Nearby Homes
- 38 Mill Rd
- 11 Lamson Ln
- 25 Stevens Rd
- 30 Josephine Dr
- 597R Lafayette Rd Unit 105
- 36 Seabreeze Dr
- 20 Sandpiper Path
- 407 Lafayette Rd
- 12 Runnymede Dr
- 10 Mcdermott Rd
- 89 Winnacunnet Rd Unit 6
- 415 High St Unit 3
- 467 High St Unit 10
- 193 Mill Rd
- 49 Exeter Rd
- 3 Swett Dr
- 939 Ocean Blvd Unit 14
- 12 Smith Ave
- 190 Kings Hwy Unit A1
- 947 Ocean Blvd Unit 17
Your Personal Tour Guide
Ask me questions while you tour the home.