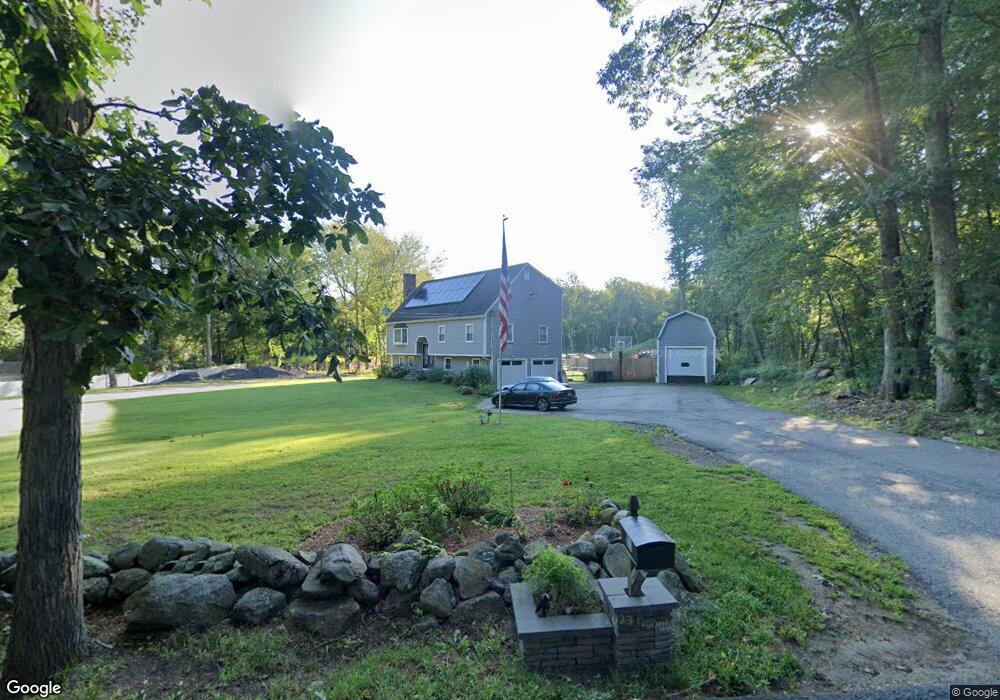
29 Mowry St Mendon, MA 01756
Estimated Value: $610,000 - $636,941
3
Beds
3
Baths
2,112
Sq Ft
$295/Sq Ft
Est. Value
About This Home
This home is located at 29 Mowry St, Mendon, MA 01756 and is currently estimated at $622,235, approximately $294 per square foot. 29 Mowry St is a home located in Worcester County with nearby schools including Nipmuc Regional High School and Our Lady of the Valley Regional School.
Ownership History
Date
Name
Owned For
Owner Type
Purchase Details
Closed on
Apr 6, 2006
Sold by
Leoncini Michael P
Bought by
Stgermain James W and Stgermain Mindy
Current Estimated Value
Home Financials for this Owner
Home Financials are based on the most recent Mortgage that was taken out on this home.
Original Mortgage
$288,000
Outstanding Balance
$164,547
Interest Rate
6.26%
Mortgage Type
Purchase Money Mortgage
Estimated Equity
$457,688
Purchase Details
Closed on
Jun 30, 2004
Sold by
Leoncini Michael P and Leoncini Suzanne
Bought by
Leoncini Michael P
Purchase Details
Closed on
Jul 16, 1992
Sold by
Nydam Donald F and Nydam Dianne
Bought by
Leoncini Michael P
Create a Home Valuation Report for This Property
The Home Valuation Report is an in-depth analysis detailing your home's value as well as a comparison with similar homes in the area
Home Values in the Area
Average Home Value in this Area
Purchase History
| Date | Buyer | Sale Price | Title Company |
|---|---|---|---|
| Stgermain James W | $360,000 | -- | |
| Leoncini Michael P | -- | -- | |
| Leoncini Michael P | $140,000 | -- |
Source: Public Records
Mortgage History
| Date | Status | Borrower | Loan Amount |
|---|---|---|---|
| Open | Stgermain James W | $288,000 |
Source: Public Records
Tax History
| Year | Tax Paid | Tax Assessment Tax Assessment Total Assessment is a certain percentage of the fair market value that is determined by local assessors to be the total taxable value of land and additions on the property. | Land | Improvement |
|---|---|---|---|---|
| 2025 | $8,263 | $617,100 | $174,200 | $442,900 |
| 2024 | $8,186 | $597,100 | $167,500 | $429,600 |
| 2023 | $7,982 | $546,700 | $149,400 | $397,300 |
| 2022 | $7,549 | $489,900 | $145,600 | $344,300 |
| 2021 | $7,497 | $446,500 | $141,200 | $305,300 |
| 2020 | $7,162 | $427,600 | $141,200 | $286,400 |
| 2019 | $6,415 | $383,200 | $137,200 | $246,000 |
| 2018 | $5,912 | $348,600 | $137,200 | $211,400 |
| 2017 | $6,102 | $343,800 | $137,200 | $206,600 |
| 2016 | $6,017 | $348,800 | $145,100 | $203,700 |
| 2015 | $5,357 | $334,600 | $145,100 | $189,500 |
| 2014 | $5,152 | $321,600 | $140,600 | $181,000 |
Source: Public Records
Map
Nearby Homes
- 25 Dunny Cove Ln
- 13A Asylum St
- 27 Taft Ave
- 23 Uxbridge Rd
- 76 Pouts Ln
- 35 Pouts Ln
- 44 Pouts Ln
- 53 Asylum St
- 14 Kelley Rd
- 13 Kelley Rd
- 10 Wesley Dr
- 183 Blackstone St
- 223 Mendon St
- 8 Washington St
- 55 Northbridge Rd
- 26 Maple St
- 220 Millville Rd
- 7 Jewell Crossing
- 17 Forest Park Dr
- 218 E Hartford Ave Unit 218
Your Personal Tour Guide
Ask me questions while you tour the home.