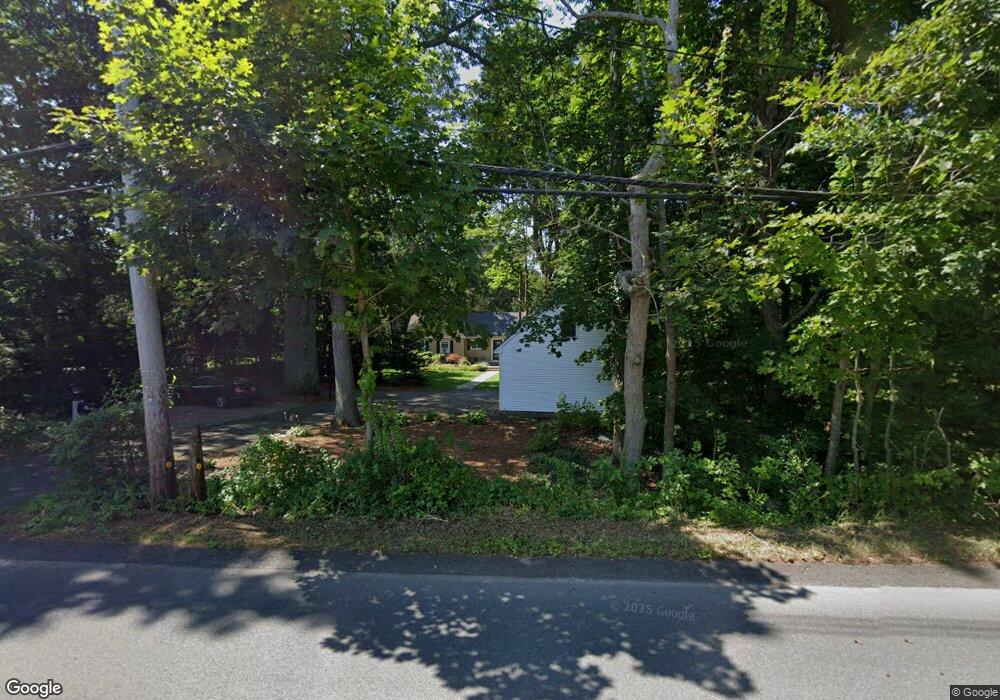
29 Newton St Weston, MA 02493
Estimated Value: $1,301,000 - $1,780,000
3
Beds
3
Baths
1,795
Sq Ft
$826/Sq Ft
Est. Value
About This Home
This home is located at 29 Newton St, Weston, MA 02493 and is currently estimated at $1,482,888, approximately $826 per square foot. 29 Newton St is a home located in Middlesex County with nearby schools including Country Elementary School, Woodland Elementary School, and Weston Middle School.
Ownership History
Date
Name
Owned For
Owner Type
Purchase Details
Closed on
Oct 22, 2021
Sold by
King Steven J
Bought by
Steven J King 2021 Ret
Current Estimated Value
Purchase Details
Closed on
Feb 20, 1998
Sold by
Hines Nancy E and Coy Carol A
Bought by
Devries Karie L and King Steven J
Home Financials for this Owner
Home Financials are based on the most recent Mortgage that was taken out on this home.
Original Mortgage
$373,825
Interest Rate
6.9%
Mortgage Type
Purchase Money Mortgage
Create a Home Valuation Report for This Property
The Home Valuation Report is an in-depth analysis detailing your home's value as well as a comparison with similar homes in the area
Home Values in the Area
Average Home Value in this Area
Purchase History
| Date | Buyer | Sale Price | Title Company |
|---|---|---|---|
| Steven J King 2021 Ret | -- | None Available | |
| King Steven J | -- | None Available | |
| Devries Karie L | $391,984 | -- |
Source: Public Records
Mortgage History
| Date | Status | Borrower | Loan Amount |
|---|---|---|---|
| Previous Owner | Devries Karie L | $417,000 | |
| Previous Owner | Devries Karie L | $373,825 |
Source: Public Records
Tax History Compared to Growth
Tax History
| Year | Tax Paid | Tax Assessment Tax Assessment Total Assessment is a certain percentage of the fair market value that is determined by local assessors to be the total taxable value of land and additions on the property. | Land | Improvement |
|---|---|---|---|---|
| 2025 | $12,273 | $1,105,700 | $761,400 | $344,300 |
| 2024 | $12,081 | $1,086,400 | $761,400 | $325,000 |
| 2023 | $12,185 | $1,029,100 | $761,400 | $267,700 |
| 2022 | $11,829 | $923,400 | $721,100 | $202,300 |
| 2021 | $11,383 | $877,000 | $683,700 | $193,300 |
| 2020 | $11,075 | $863,200 | $683,700 | $179,500 |
| 2019 | $10,389 | $825,200 | $648,500 | $176,700 |
| 2018 | $10,323 | $825,200 | $648,500 | $176,700 |
| 2017 | $10,399 | $838,600 | $648,500 | $190,100 |
| 2016 | $10,197 | $838,600 | $648,500 | $190,100 |
| 2015 | $9,850 | $802,100 | $617,400 | $184,700 |
Source: Public Records
Map
Nearby Homes
- 49 Newton St
- 41 Orchard Ave
- 23 Stonecroft Cir
- 60 Possum Rd
- 2 Candleberry Ln
- 103 Loring Rd
- 217 Summer St
- 154 Newton St
- 9 Atlas Ln
- 4 Willow Rd
- 3 Idlewile Ln
- 8 Old Town Rd
- 17 Deforest Rd
- 707 South St
- 226 Ash St
- 27 Oakwood Rd
- 180 Ash St
- 0 Wellesley St
- 2202 Commonwealth Ave Unit 2
- 2202 Commonwealth Ave Unit 1