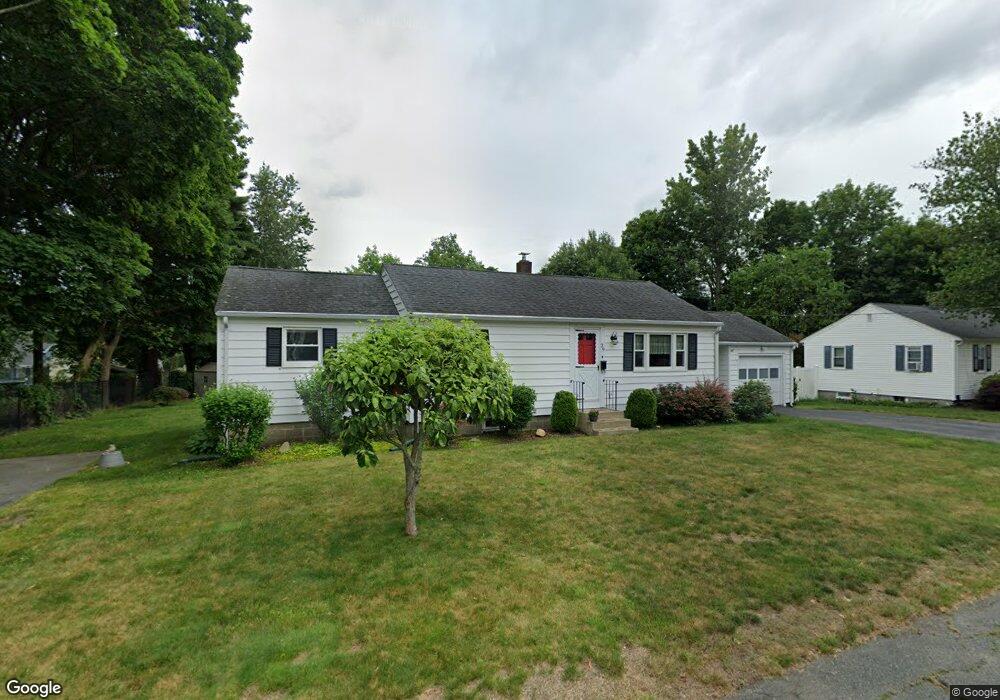
29 O Brien Ave Whitman, MA 02382
Estimated Value: $425,000 - $510,000
3
Beds
1
Bath
1,284
Sq Ft
$373/Sq Ft
Est. Value
About This Home
This home is located at 29 O Brien Ave, Whitman, MA 02382 and is currently estimated at $478,905, approximately $372 per square foot. 29 O Brien Ave is a home located in Plymouth County with nearby schools including St Bridget School, Trinity Catholic Academy, and Cardinal Spellman High School.
Ownership History
Date
Name
Owned For
Owner Type
Purchase Details
Closed on
Feb 27, 2023
Sold by
Schofield Jennifer L
Bought by
Jenniifer L Schofield Irt
Current Estimated Value
Purchase Details
Closed on
Jul 24, 2019
Sold by
Schofield Douglas S and Schofield Jennifer L
Bought by
Schofield Jennifer L and Schofield Douglas S
Purchase Details
Closed on
Sep 15, 2000
Sold by
Holbrook Albina L
Bought by
Schofield Douglas S and Schofield Jennifer L
Create a Home Valuation Report for This Property
The Home Valuation Report is an in-depth analysis detailing your home's value as well as a comparison with similar homes in the area
Home Values in the Area
Average Home Value in this Area
Purchase History
| Date | Buyer | Sale Price | Title Company |
|---|---|---|---|
| Jenniifer L Schofield Irt | -- | None Available | |
| Schofield Jennifer L | -- | -- | |
| Schofield Douglas S | $170,000 | -- |
Source: Public Records
Mortgage History
| Date | Status | Borrower | Loan Amount |
|---|---|---|---|
| Previous Owner | Schofield Douglas S | $100,000 | |
| Previous Owner | Schofield Douglas S | $25,000 | |
| Previous Owner | Schofield Douglas S | $138,250 |
Source: Public Records
Tax History Compared to Growth
Tax History
| Year | Tax Paid | Tax Assessment Tax Assessment Total Assessment is a certain percentage of the fair market value that is determined by local assessors to be the total taxable value of land and additions on the property. | Land | Improvement |
|---|---|---|---|---|
| 2025 | $5,643 | $430,100 | $211,900 | $218,200 |
| 2024 | $5,336 | $418,800 | $207,800 | $211,000 |
| 2023 | $5,153 | $379,700 | $180,200 | $199,500 |
| 2022 | $5,014 | $344,400 | $163,800 | $180,600 |
| 2021 | $4,862 | $313,700 | $150,500 | $163,200 |
| 2020 | $4,478 | $282,500 | $136,100 | $146,400 |
| 2019 | $4,174 | $271,400 | $136,100 | $135,300 |
| 2018 | $4,009 | $250,400 | $129,000 | $121,400 |
| 2017 | $3,776 | $250,400 | $129,000 | $121,400 |
| 2016 | $3,593 | $230,500 | $122,800 | $107,700 |
| 2015 | $3,598 | $230,500 | $122,800 | $107,700 |
Source: Public Records
Map
Nearby Homes
- 66 Belmont St
- 300 High St
- 164 Warren Ave
- 360 High St
- 604 Bedford St Unit 5
- 1098 Bedford St
- 4 Locust Hill Ln
- 135-137 Temple St
- 262 Homeland Dr
- 551 Bedford St Unit B4
- 11 Glenwood St
- 277 School St
- 53 Temple St
- 78 Linda St
- 63 Rice St
- 63 Dewey Ave
- 501 Auburn St Unit 404
- 501 Auburn St Unit 201
- 877 Auburnville Way Unit D4
- 627 Auburn St