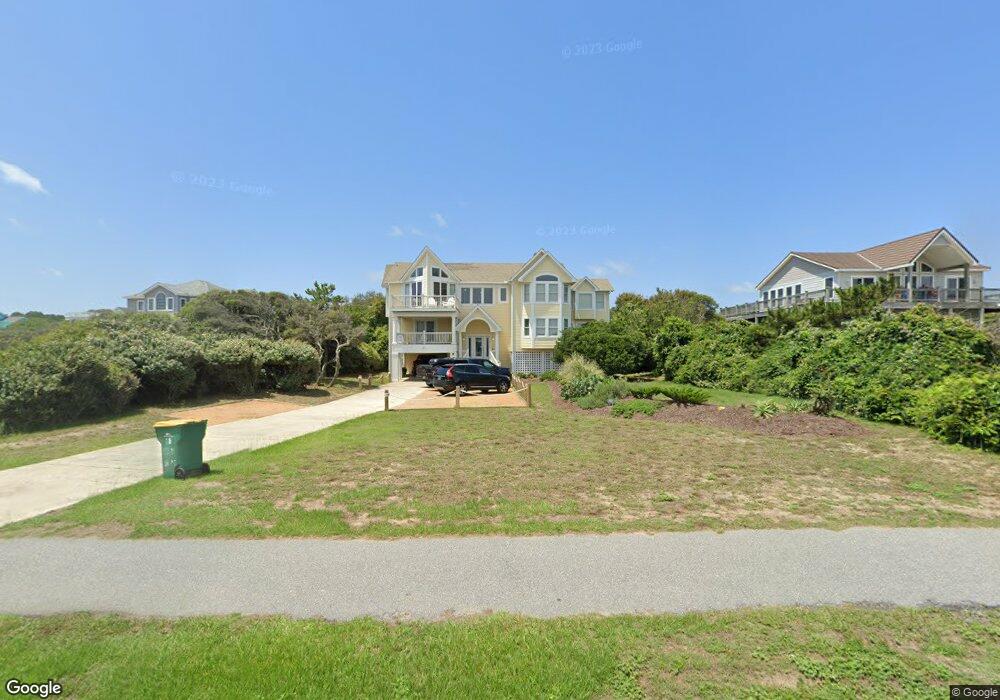
29 Ocean Blvd Unit 3-4 Kitty Hawk, NC 27949
Estimated Value: $1,543,000 - $1,694,000
7
Beds
8
Baths
4,639
Sq Ft
$352/Sq Ft
Est. Value
About This Home
This home is located at 29 Ocean Blvd Unit 3-4, Kitty Hawk, NC 27949 and is currently estimated at $1,633,864, approximately $352 per square foot. 29 Ocean Blvd Unit 3-4 is a home located in Dare County with nearby schools including Kitty Hawk Elementary School, First Flight Middle School, and First Flight High School.
Ownership History
Date
Name
Owned For
Owner Type
Purchase Details
Closed on
Dec 4, 2020
Sold by
29 Ocean Blvd Llc
Bought by
Dreamland Obx Llc
Current Estimated Value
Home Financials for this Owner
Home Financials are based on the most recent Mortgage that was taken out on this home.
Original Mortgage
$769,600
Outstanding Balance
$683,718
Interest Rate
2.71%
Mortgage Type
Future Advance Clause Open End Mortgage
Estimated Equity
$950,146
Purchase Details
Closed on
Apr 6, 2016
Sold by
Southern Shores Investments Llc
Bought by
29 Ocean Blvd Llc
Home Financials for this Owner
Home Financials are based on the most recent Mortgage that was taken out on this home.
Original Mortgage
$671,250
Interest Rate
3.68%
Mortgage Type
New Conventional
Purchase Details
Closed on
Dec 13, 2007
Sold by
Parker William Robert and Parker Julius Dolglas
Bought by
Southern Shores Investmnets Llc
Create a Home Valuation Report for This Property
The Home Valuation Report is an in-depth analysis detailing your home's value as well as a comparison with similar homes in the area
Home Values in the Area
Average Home Value in this Area
Purchase History
| Date | Buyer | Sale Price | Title Company |
|---|---|---|---|
| Dreamland Obx Llc | $962,000 | None Available | |
| Dreamland Obx Llc | $962,000 | None Listed On Document | |
| 29 Ocean Blvd Llc | -- | None Available | |
| Southern Shores Investmnets Llc | -- | None Available |
Source: Public Records
Mortgage History
| Date | Status | Borrower | Loan Amount |
|---|---|---|---|
| Open | Dreamland Obx Llc | $769,600 | |
| Closed | Dreamland Obx Llc | $769,600 | |
| Previous Owner | 29 Ocean Blvd Llc | $671,250 |
Source: Public Records
Tax History
| Year | Tax Paid | Tax Assessment Tax Assessment Total Assessment is a certain percentage of the fair market value that is determined by local assessors to be the total taxable value of land and additions on the property. | Land | Improvement |
|---|---|---|---|---|
| 2025 | $15 | $1,431,600 | $574,000 | $857,600 |
| 2024 | $7,340 | $1,068,900 | $252,000 | $816,900 |
| 2023 | $4,281 | $1,101,576 | $252,000 | $849,576 |
| 2022 | $7,340 | $1,101,576 | $252,000 | $849,576 |
| 2021 | $7,362 | $1,101,576 | $252,000 | $849,576 |
| 2020 | $6,569 | $1,101,576 | $252,000 | $849,576 |
| 2019 | $6,866 | $962,500 | $311,700 | $650,800 |
| 2018 | $6,888 | $962,500 | $311,700 | $650,800 |
| 2017 | $6,866 | $962,500 | $311,700 | $650,800 |
| 2016 | $6,468 | $962,500 | $311,700 | $650,800 |
| 2014 | $6,468 | $962,500 | $311,700 | $650,800 |
Source: Public Records
Map
Nearby Homes
- 95 Skyline Rd Unit Lot 27-28
- 4 Sea Bass Cir Unit Lot B
- 177 Happy Indian Ct Unit Lot 277
- 27 Juniper Trail Unit Lot 13
- 40 Juniper Trail Unit Lot 6
- 117 Pudding Pan Unit Lot 207
- 5118 Virginia Dare Trail N Unit Lot 7
- 28 Duck Woods Dr Unit Lot 5
- 5007 Lindbergh Ave Unit Lot29A
- 5138 Sycamore Ln Unit Lot 54
- 75 Duck Woods Dr Unit Lot 25
- 76A Ocean Blvd Unit Lot 3
- 4901 Lindbergh Ave Unit Lot 4001
- 0 N The Woods Rd
- 4713 Summer Ln Unit Lot233
- 175 Chicahauk Trail Unit Lot 541
- 4705 Summer Ln Unit Lot 2
- 5124 The Woods Rd Unit Lot 21
- 2017 Creek Rd Unit Lot 20
- 1005 Creek Rd Unit Lot 2
- 29 Ocean Blvd
- 27 Ocean Blvd
- 31 Ocean Blvd Unit 5-6
- 31 Ocean Blvd
- 14 Oceanview Loop
- 12 Ocean View Loop Unit 12
- 12 Oceanview Loop
- 33 Ocean Blvd
- 25 Ocean View Loop Unit 24
- 25 Ocean Blvd
- 16 Oceanview Loop
- 10 Oceanview Loop
- 35 Ocean Blvd
- 18 Oceanview Loop
- 23 Ocean Blvd Unit 13 & 14
- 23 Ocean Blvd
- 28 Ocean Blvd
- 15 Oceanview Loop
- 15 Oceanview Loop
- 20 Ocean View Loop Unit Lot 17
Your Personal Tour Guide
Ask me questions while you tour the home.