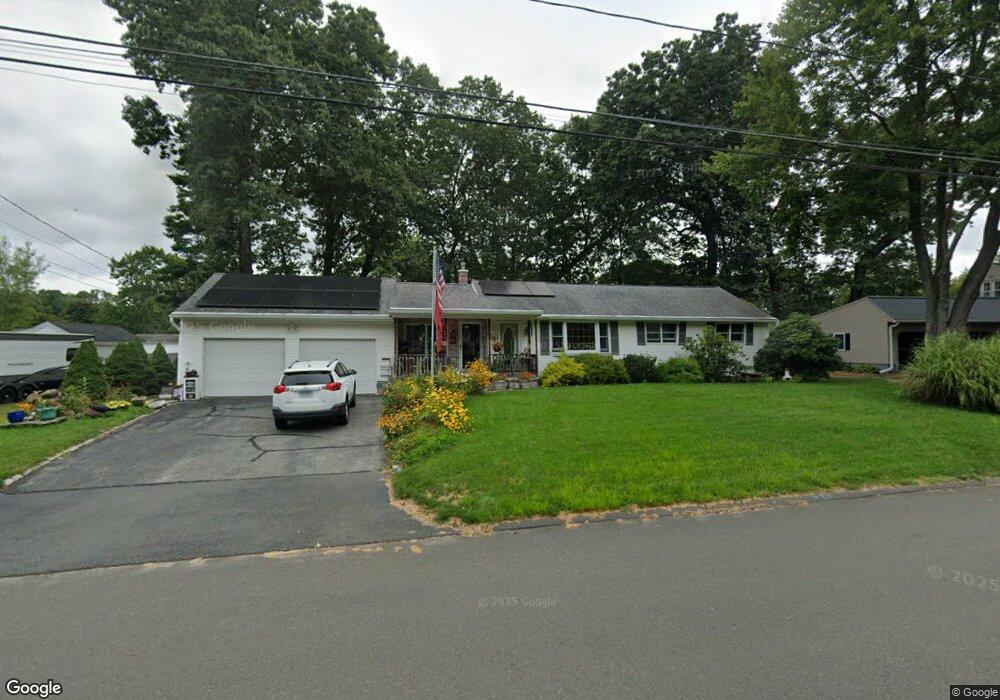
29 Play Rd Enfield, CT 06082
Estimated Value: $311,000 - $333,000
3
Beds
2
Baths
1,272
Sq Ft
$253/Sq Ft
Est. Value
About This Home
This home is located at 29 Play Rd, Enfield, CT 06082 and is currently estimated at $321,649, approximately $252 per square foot. 29 Play Rd is a home located in Hartford County with nearby schools including Eli Whitney Elementary School, Hazardville Memorial Elementary School, and Enfield High School.
Ownership History
Date
Name
Owned For
Owner Type
Purchase Details
Closed on
Jan 14, 2019
Sold by
Bianchi-Isopo Mary
Bought by
Isopo Mary Baanchi Ft
Current Estimated Value
Purchase Details
Closed on
Jun 11, 2018
Sold by
Isopo Mary B and Isopo Sante
Bought by
Isopo Mary B
Purchase Details
Closed on
Jan 11, 2016
Sold by
Isopo Mary B
Bought by
L M and Bianchi Isopo Sr L
Create a Home Valuation Report for This Property
The Home Valuation Report is an in-depth analysis detailing your home's value as well as a comparison with similar homes in the area
Home Values in the Area
Average Home Value in this Area
Purchase History
| Date | Buyer | Sale Price | Title Company |
|---|---|---|---|
| Isopo Mary Baanchi Ft | -- | -- | |
| Isopo Mary B | -- | -- | |
| L M | -- | -- |
Source: Public Records
Mortgage History
| Date | Status | Borrower | Loan Amount |
|---|---|---|---|
| Previous Owner | L M | $28,000 |
Source: Public Records
Tax History
| Year | Tax Paid | Tax Assessment Tax Assessment Total Assessment is a certain percentage of the fair market value that is determined by local assessors to be the total taxable value of land and additions on the property. | Land | Improvement |
|---|---|---|---|---|
| 2025 | $5,799 | $165,200 | $56,600 | $108,600 |
| 2024 | $5,585 | $165,200 | $56,600 | $108,600 |
| 2023 | $5,544 | $165,200 | $56,600 | $108,600 |
| 2022 | $5,103 | $165,200 | $56,600 | $108,600 |
| 2021 | $4,952 | $131,810 | $46,890 | $84,920 |
| 2020 | $4,816 | $129,050 | $46,890 | $82,160 |
| 2019 | $4,810 | $129,050 | $46,890 | $82,160 |
| 2018 | $4,681 | $129,050 | $46,890 | $82,160 |
| 2017 | $4,398 | $129,050 | $46,890 | $82,160 |
| 2016 | $4,190 | $125,590 | $48,110 | $77,480 |
| 2015 | $4,062 | $125,590 | $48,110 | $77,480 |
| 2014 | $3,960 | $125,590 | $48,110 | $77,480 |
Source: Public Records
Map
Nearby Homes
Your Personal Tour Guide
Ask me questions while you tour the home.