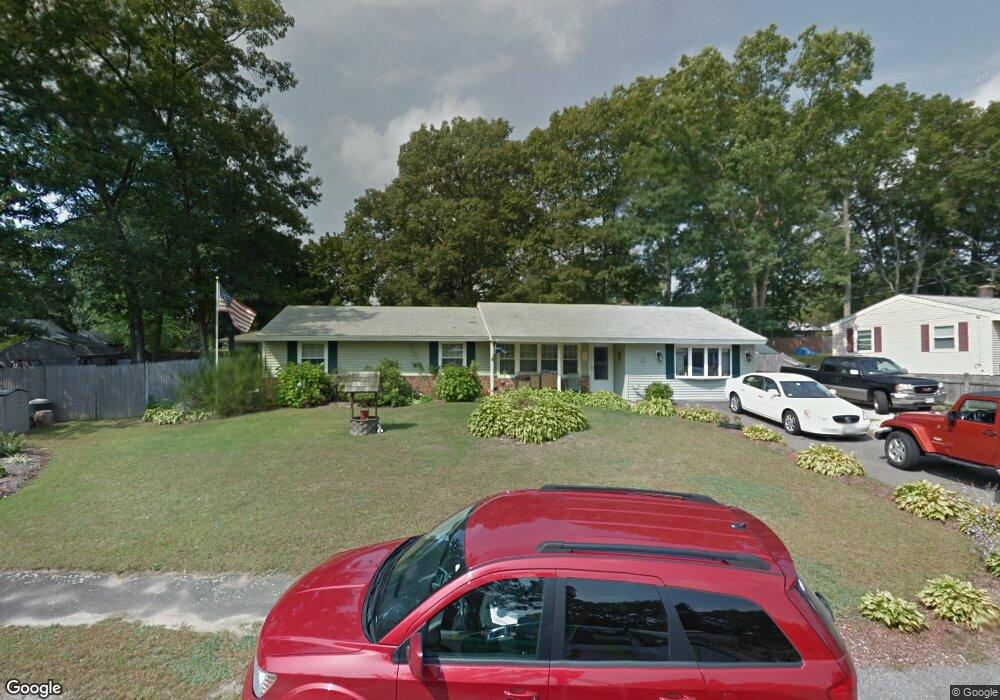
29 Porter Rd Bellingham, MA 02019
Estimated Value: $449,956 - $491,000
3
Beds
2
Baths
1,608
Sq Ft
$293/Sq Ft
Est. Value
About This Home
This home is located at 29 Porter Rd, Bellingham, MA 02019 and is currently estimated at $471,489, approximately $293 per square foot. 29 Porter Rd is a home located in Norfolk County with nearby schools including Stall Brook Elementary School, Bellingham High School, and Bethany Christian Academy.
Ownership History
Date
Name
Owned For
Owner Type
Purchase Details
Closed on
Jul 16, 1970
Bought by
Simpson John J and Simpson Mildred N
Current Estimated Value
Create a Home Valuation Report for This Property
The Home Valuation Report is an in-depth analysis detailing your home's value as well as a comparison with similar homes in the area
Home Values in the Area
Average Home Value in this Area
Purchase History
| Date | Buyer | Sale Price | Title Company |
|---|---|---|---|
| Simpson John J | $21,900 | -- |
Source: Public Records
Mortgage History
| Date | Status | Borrower | Loan Amount |
|---|---|---|---|
| Open | Simpson John J | $80,000 | |
| Closed | Simpson John J | $93,500 |
Source: Public Records
Tax History Compared to Growth
Tax History
| Year | Tax Paid | Tax Assessment Tax Assessment Total Assessment is a certain percentage of the fair market value that is determined by local assessors to be the total taxable value of land and additions on the property. | Land | Improvement |
|---|---|---|---|---|
| 2025 | $4,854 | $386,500 | $165,400 | $221,100 |
| 2024 | $4,624 | $359,600 | $151,000 | $208,600 |
| 2023 | $4,458 | $341,600 | $143,800 | $197,800 |
| 2022 | $4,303 | $305,600 | $119,900 | $185,700 |
| 2021 | $4,188 | $290,600 | $119,900 | $170,700 |
| 2020 | $4,007 | $281,800 | $119,900 | $161,900 |
| 2019 | $3,918 | $275,700 | $119,900 | $155,800 |
| 2018 | $3,654 | $253,600 | $115,300 | $138,300 |
| 2017 | $3,555 | $247,900 | $115,300 | $132,600 |
| 2016 | $3,408 | $238,500 | $113,400 | $125,100 |
| 2015 | $3,273 | $229,700 | $109,000 | $120,700 |
| 2014 | $3,287 | $224,200 | $106,500 | $117,700 |
Source: Public Records
Map
Nearby Homes
- 6 Lisa Ann Dr
- 49 Monique Dr
- 49 Horseshoe Dr
- 108 N Main St
- 22 Roger Belanger Dr
- 29 Rawson Rd
- 0 Hartford Ave
- 123-125 Mendon St
- 370 S Main St
- 1136 S Main St
- 270 S Main St
- 6 Mellen St
- 267 S Main St
- 17 Pine St
- 256 S Main St
- 1099 S Main St
- 7 Debra Ln
- 387 Hartford Ave
- 125 Blackstone St
- 48 Black Bear Cir Unit 48