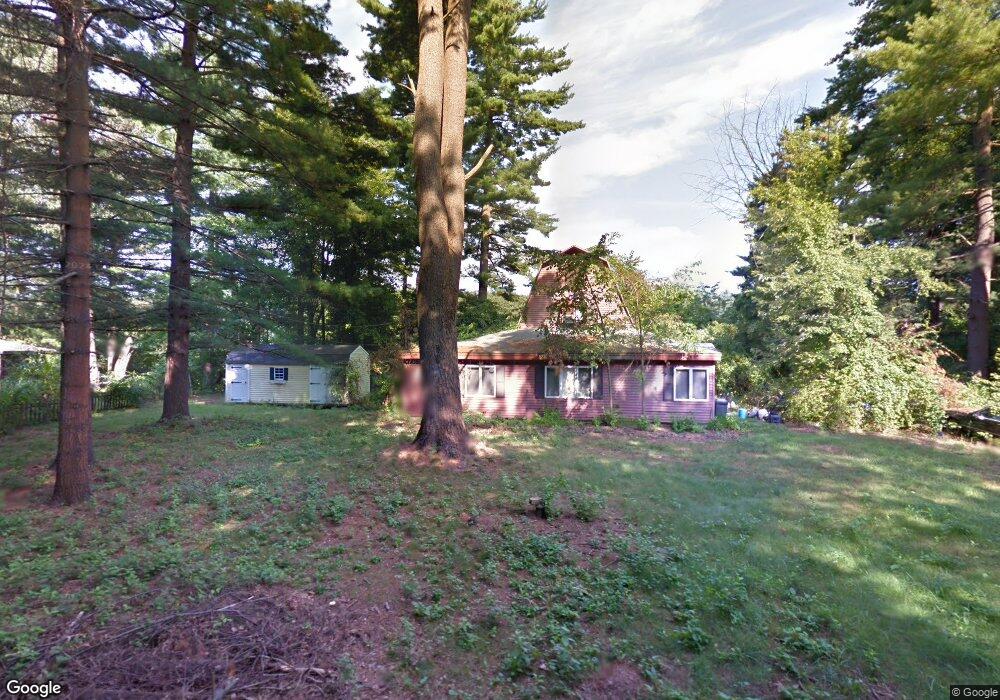
29 Riverbend Rd Unit 31 Tyngsboro, MA 01879
Estimated Value: $871,022 - $935,000
3
Beds
3
Baths
2,552
Sq Ft
$352/Sq Ft
Est. Value
About This Home
This home is located at 29 Riverbend Rd Unit 31, Tyngsboro, MA 01879 and is currently estimated at $899,006, approximately $352 per square foot. 29 Riverbend Rd Unit 31 is a home located in Middlesex County with nearby schools including Tyngsborough Elementary School, Tyngsborough Middle School, and Tyngsborough High School.
Ownership History
Date
Name
Owned For
Owner Type
Purchase Details
Closed on
Jun 13, 2017
Sold by
Rogers Juli M and Workers Cu
Bought by
Workers Cu
Current Estimated Value
Purchase Details
Closed on
Sep 17, 2009
Sold by
Moore Joseph P and Rogers Juli M
Bought by
Rogers Julie M
Purchase Details
Closed on
Sep 12, 2003
Sold by
Rogers Eugene J and Rogers Juli M
Bought by
Rogers Juli M
Create a Home Valuation Report for This Property
The Home Valuation Report is an in-depth analysis detailing your home's value as well as a comparison with similar homes in the area
Home Values in the Area
Average Home Value in this Area
Purchase History
| Date | Buyer | Sale Price | Title Company |
|---|---|---|---|
| Workers Cu | $160,000 | -- | |
| Rogers Julie M | -- | -- | |
| Rogers Juli M | -- | -- |
Source: Public Records
Tax History Compared to Growth
Tax History
| Year | Tax Paid | Tax Assessment Tax Assessment Total Assessment is a certain percentage of the fair market value that is determined by local assessors to be the total taxable value of land and additions on the property. | Land | Improvement |
|---|---|---|---|---|
| 2025 | $93 | $753,200 | $220,000 | $533,200 |
| 2024 | $9,123 | $717,200 | $213,800 | $503,400 |
| 2023 | $2,614 | $184,900 | $178,500 | $6,400 |
| 2022 | $2,543 | $170,200 | $164,000 | $6,200 |
| 2021 | $2,491 | $155,000 | $149,500 | $5,500 |
| 2020 | $2,312 | $142,300 | $137,000 | $5,300 |
| 2019 | $2,299 | $135,800 | $130,800 | $5,000 |
| 2018 | $2,452 | $143,300 | $130,800 | $12,500 |
| 2017 | $4,400 | $256,400 | $130,800 | $125,600 |
| 2016 | $4,357 | $248,100 | $122,500 | $125,600 |
| 2015 | $4,208 | $248,100 | $122,500 | $125,600 |
Source: Public Records
Map
Nearby Homes
- 56 Frost Rd
- 75 Frost Rd
- 1 Patricia Dr
- 33 Phalanx St
- 46 Pawtucket Blvd Unit 38
- 46 Pawtucket Blvd Unit 37
- 30 Tamarack Way Unit 30
- 52 Pawtucket Blvd Unit 21
- 26 Juniper Ln Unit 64
- 22 Juniper Ln Unit 66
- 20 Juniper Ln Unit 67
- 28 Juniper Ln Unit 65
- 11 Juniper Ln Unit 14
- 32 Juniper Ln Unit 61
- 43 Juniper Ln Unit 30
- 17 Juniper Ln Unit 17
- 15 Norris Rd
- 17 Norris Rd
- 1 Wintergreen Dr
- 24 Fletcher Dr