Estimated Value: $84,000 - $158,000
2
Beds
1
Bath
800
Sq Ft
$144/Sq Ft
Est. Value
About This Home
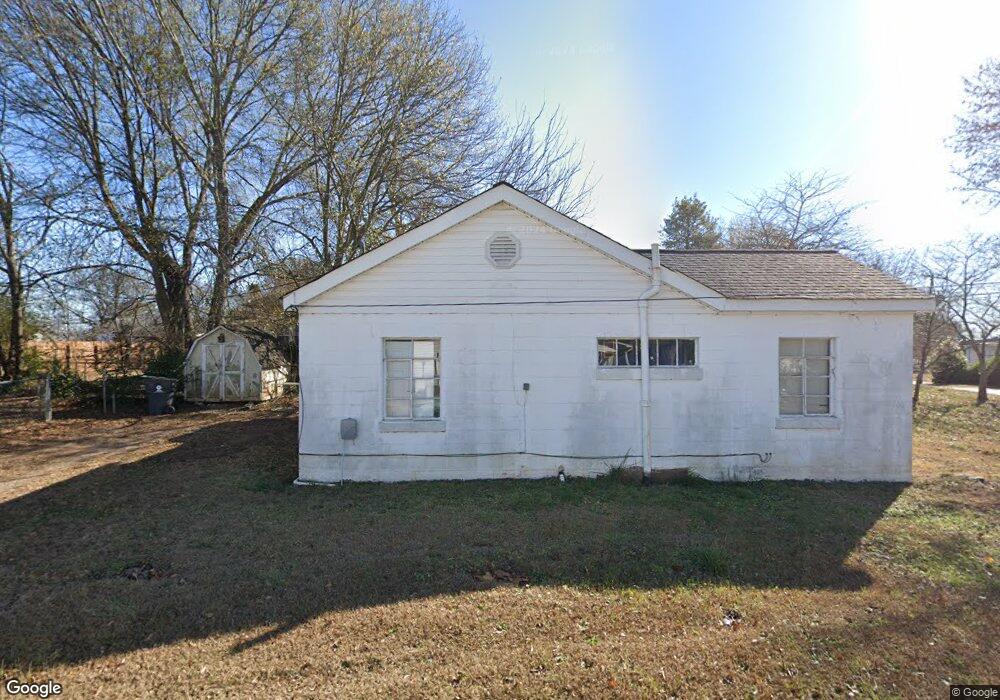
This home is located at 29 S Howard St, Inman, SC 29349 and is currently estimated at $115,423, approximately $144 per square foot. 29 S Howard St is a home located in Spartanburg County with nearby schools including Inman Elementary School, T.E. Mabry Middle School, and Chapman High School.
Ownership History
Date
Name
Owned For
Owner Type
Purchase Details
Closed on
May 8, 2016
Sold by
Ledbetter Richard I
Bought by
Stephens Gary W and Stephens Mildred
Current Estimated Value
Purchase Details
Closed on
Aug 29, 2014
Sold by
Estate Of Grace Ledbetter and Ledbetter Richard I
Bought by
Ledbetter Richard Isaac and Ledbetter Richard I
Purchase Details
Closed on
Jun 25, 2010
Sold by
Mundy Johnny R and Mundy Mary E
Bought by
Ledbetter Richard and Ledbetter Grace
Purchase Details
Closed on
May 15, 2008
Sold by
Ledbetter Richard and Ledbetter Grace
Bought by
Mundy Johnny R and Mundy Mary E
Purchase Details
Closed on
Oct 26, 2006
Sold by
Stephens Gary W and Stephens Mildred
Bought by
Ledbetter Richard and Ledbetter Grace
Purchase Details
Closed on
Feb 11, 2003
Sold by
Stephens Gary Wayne and Stephens Mildred
Bought by
Nelson Bryon R
Home Financials for this Owner
Home Financials are based on the most recent Mortgage that was taken out on this home.
Original Mortgage
$42,500
Interest Rate
8%
Mortgage Type
Seller Take Back
Purchase Details
Closed on
May 28, 2002
Sold by
Jackson Bobby Dean and Jackson Alice W
Bought by
Stephens Gary Wayne and Stephens Mildred Louise
Create a Home Valuation Report for This Property
The Home Valuation Report is an in-depth analysis detailing your home's value as well as a comparison with similar homes in the area
Home Values in the Area
Average Home Value in this Area
Purchase History
| Date | Buyer | Sale Price | Title Company |
|---|---|---|---|
| Stephens Gary W | -- | None Available | |
| Ledbetter Richard Isaac | -- | -- | |
| Ledbetter Richard | -- | -- | |
| Mundy Johnny R | $45,000 | -- | |
| Ledbetter Richard | $40,000 | None Available | |
| Nelson Bryon R | $52,500 | -- | |
| Stephens Gary Wayne | $33,000 | -- |
Source: Public Records
Mortgage History
| Date | Status | Borrower | Loan Amount |
|---|---|---|---|
| Previous Owner | Nelson Bryon R | $42,500 |
Source: Public Records
Tax History Compared to Growth
Tax History
| Year | Tax Paid | Tax Assessment Tax Assessment Total Assessment is a certain percentage of the fair market value that is determined by local assessors to be the total taxable value of land and additions on the property. | Land | Improvement |
|---|---|---|---|---|
| 2025 | $1,470 | $3,055 | $648 | $2,407 |
| 2024 | $1,470 | $3,055 | $648 | $2,407 |
| 2023 | $1,470 | $3,055 | $648 | $2,407 |
| 2022 | $1,325 | $2,657 | $280 | $2,377 |
| 2021 | $1,312 | $2,657 | $280 | $2,377 |
| 2020 | $1,293 | $2,657 | $280 | $2,377 |
| 2019 | $1,301 | $2,657 | $280 | $2,377 |
| 2018 | $1,293 | $2,657 | $280 | $2,377 |
| 2017 | $1,107 | $2,310 | $300 | $2,010 |
| 2016 | $1,090 | $2,310 | $300 | $2,010 |
| 2015 | $1,085 | $2,310 | $300 | $2,010 |
| 2014 | $1,064 | $2,310 | $300 | $2,010 |
Source: Public Records
Map
Nearby Homes