
Landlord's Agent in 2024
Amanda Kundel
Kinlin Grover Compass
(508) 362-2120
8 in this area
133 Total Sales


Estimated Value: $1,352,000 - $1,520,568
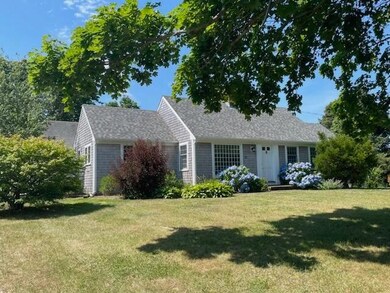
WINTER/OFF-SEASON RENTAL Available immediately. Upscale furnished home in fantastic location! This newly renovated home boasts charm and space that is unparalleled. Gourmet kitchen, open concept living space, 2 bedrooms including primary bedroom with private bath, den/tv room, sunroom, and screened in porch. Excellent entertaining space outside as well on the private back deck and patio. A cheerful mudroom area, enclosed outdoor shower, and 2 car garage completes this wonderful home. Tucked away in one of the most sought after neighborhoods on Cape Cod. One block to the ocean with access to a private beach and set amongst a sanctuary-like setting, you will be inspired to relax like never before. There are sidewalks leading into a quaint downtown area where you will find many dining options, a market with drinks and prepared foods, gourmet coffee shop, library, post office & more. No smoking. Pets considered. 1st, last & security deposit of one month's rent requested. Application process with credit check.
Last Agent to Rent the Property
Kinlin Grover Compass License #9521133 Listed on: 08/19/2024
| Date | Buyer | Sale Price | Title Company |
|---|---|---|---|
| Int Salten | $772,500 | None Available | |
| Virginia Lukingbeal T | -- | -- |
| Date | Event | Price | List to Sale | Price per Sq Ft |
|---|---|---|---|---|
| 09/10/2024 09/10/24 | Rented | $4,000 | -11.1% | -- |
| 08/19/2024 08/19/24 | For Rent | $4,500 | -- | -- |
| Year | Tax Paid | Tax Assessment Tax Assessment Total Assessment is a certain percentage of the fair market value that is determined by local assessors to be the total taxable value of land and additions on the property. | Land | Improvement |
|---|---|---|---|---|
| 2025 | $13,977 | $1,512,700 | $1,083,700 | $429,000 |
| 2024 | $13,179 | $1,504,500 | $1,083,700 | $420,800 |
| 2023 | $12,129 | $1,350,700 | $985,200 | $365,500 |
| 2022 | $9,155 | $820,300 | $533,300 | $287,000 |
| 2021 | $8,833 | $754,300 | $516,400 | $237,900 |
| 2020 | $9,020 | $735,700 | $516,400 | $219,300 |
| 2019 | $8,670 | $709,500 | $516,400 | $193,100 |
| 2018 | $9,649 | $767,000 | $602,700 | $164,300 |
| 2017 | $9,483 | $758,600 | $602,700 | $155,900 |
| 2016 | $9,201 | $746,200 | $590,300 | $155,900 |
| 2015 | $8,226 | $679,300 | $515,100 | $164,200 |
Landlord's Agent in 2024
Amanda Kundel
Kinlin Grover Compass
(508) 362-2120
8 in this area
133 Total Sales
Source: Cape Cod & Islands Association of REALTORS®
MLS Number: 22403946
APN: BARN-000280-000000-000009
Disclaimer: Certain information contained herein is derived from information provided by parties other than Homes.com. All information provided is deemed reliable, but is not guaranteed to be accurate and should be independently verified.
![]() All data relating to real estate for sale on this page comes from the Broker Reciprocity (BR) of the Cape Cod & Islands Multiple Listing Service, Inc. Detailed information about real estate listings held by brokerage firms other than CC&I Assoc. of REALTORS®, Inc. includes the name of the listing company. Neither the listing company nor CC&I Assoc. of REALTORS®, Inc. shall be responsible for any typographical errors, misinformation, misprints and shall be held totally harmless. The Broker providing this data believes it to be correct, but advises interested parties to confirm any item before relying on it in a purchase decision. All properties are subject to prior sale, changes, or withdrawal. Copyright 2026 © Cape Cod & Islands Multiple Listing Service, Inc. All rights reserved.
All data relating to real estate for sale on this page comes from the Broker Reciprocity (BR) of the Cape Cod & Islands Multiple Listing Service, Inc. Detailed information about real estate listings held by brokerage firms other than CC&I Assoc. of REALTORS®, Inc. includes the name of the listing company. Neither the listing company nor CC&I Assoc. of REALTORS®, Inc. shall be responsible for any typographical errors, misinformation, misprints and shall be held totally harmless. The Broker providing this data believes it to be correct, but advises interested parties to confirm any item before relying on it in a purchase decision. All properties are subject to prior sale, changes, or withdrawal. Copyright 2026 © Cape Cod & Islands Multiple Listing Service, Inc. All rights reserved.
Ask me questions while you tour the home.