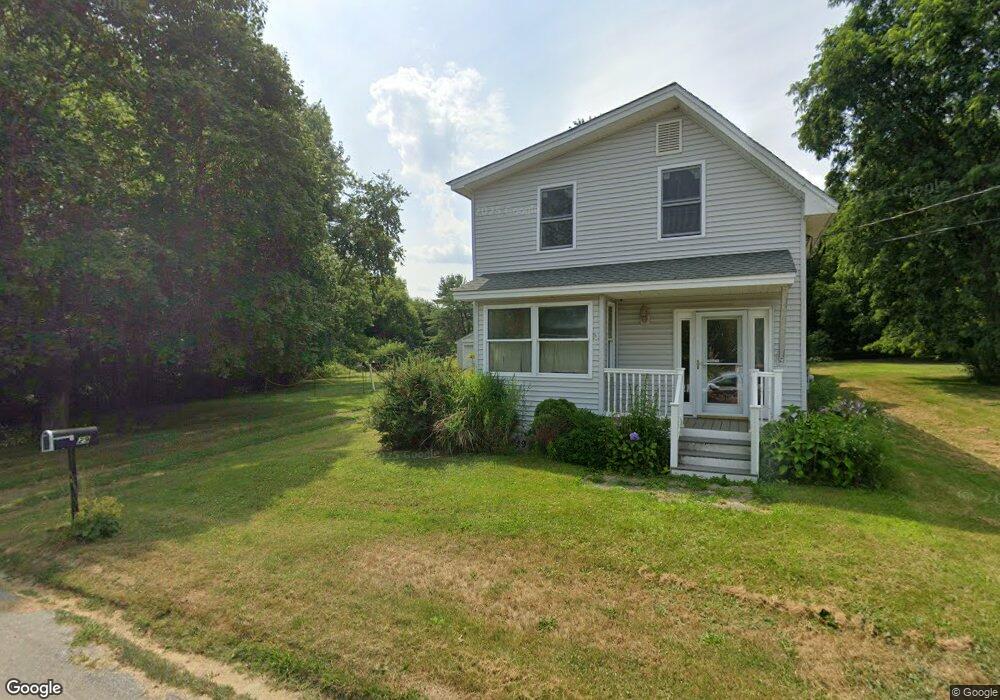
29 Spring St Newport, ME 04953
Estimated Value: $255,000 - $281,000
5
Beds
2
Baths
1,610
Sq Ft
$166/Sq Ft
Est. Value
About This Home
This home is located at 29 Spring St, Newport, ME 04953 and is currently estimated at $267,970, approximately $166 per square foot. 29 Spring St is a home located in Penobscot County with nearby schools including Sebasticook Valley Elementary School and Nokomis Regional Middle School/High School.
Ownership History
Date
Name
Owned For
Owner Type
Purchase Details
Closed on
Jun 17, 2008
Sold by
Deutsche Bank Natl T Co
Bought by
Erickson Charles E and Moss Jane
Current Estimated Value
Purchase Details
Closed on
Jan 11, 2005
Sold by
Rezendes Krystal L and Baker Jason M
Bought by
Herrera Destiny M and Elliott Clyde L
Home Financials for this Owner
Home Financials are based on the most recent Mortgage that was taken out on this home.
Original Mortgage
$104,000
Interest Rate
5.75%
Mortgage Type
Purchase Money Mortgage
Create a Home Valuation Report for This Property
The Home Valuation Report is an in-depth analysis detailing your home's value as well as a comparison with similar homes in the area
Home Values in the Area
Average Home Value in this Area
Purchase History
| Date | Buyer | Sale Price | Title Company |
|---|---|---|---|
| Erickson Charles E | -- | -- | |
| Herrera Destiny M | -- | -- |
Source: Public Records
Mortgage History
| Date | Status | Borrower | Loan Amount |
|---|---|---|---|
| Previous Owner | Herrera Destiny M | $104,000 |
Source: Public Records
Tax History
| Year | Tax Paid | Tax Assessment Tax Assessment Total Assessment is a certain percentage of the fair market value that is determined by local assessors to be the total taxable value of land and additions on the property. | Land | Improvement |
|---|---|---|---|---|
| 2024 | $2,951 | $168,600 | $26,900 | $141,700 |
| 2023 | $2,571 | $157,700 | $25,200 | $132,500 |
| 2022 | $2,442 | $124,600 | $19,900 | $104,700 |
| 2021 | $2,451 | $119,000 | $19,000 | $100,000 |
| 2020 | $2,408 | $116,900 | $18,700 | $98,200 |
| 2019 | $2,347 | $110,200 | $17,600 | $92,600 |
| 2018 | $2,347 | $110,200 | $17,600 | $92,600 |
| 2017 | $2,204 | $110,200 | $17,600 | $92,600 |
| 2016 | $2,138 | $110,200 | $17,600 | $92,600 |
| 2015 | $1,973 | $110,200 | $17,600 | $92,600 |
| 2014 | $1,897 | $110,300 | $17,600 | $92,700 |
Source: Public Records
Map
Nearby Homes
- 22 Shaw St
- 61 Elm St
- 49 North St
- 8 Grove St
- 22 Grove St
- 205 Elm St
- 16 Libby Hill Rd
- 107 Barrows Point Rd
- 448 Elm St
- L 030 Hart St
- 5 North Rd
- 315 Golf Course Rd
- lot 6 Golf Course Rd Unit Lot 6
- 14 Main St
- 84 Morse Rd
- 21 S Main St
- Lot 2 Golf Course Cameo Sub Rd
- lot 5 Golf Course Cameo Sub Rd
- 107 Shady Ln
- 009-007 Lilly Dr
Your Personal Tour Guide
Ask me questions while you tour the home.