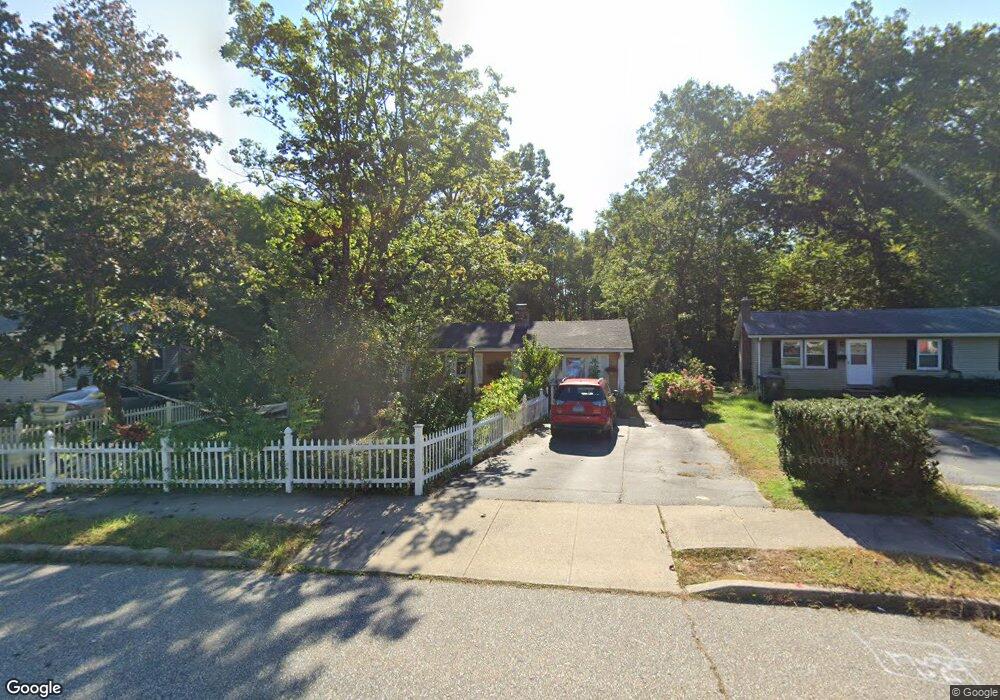
29 Spring View Ln Willimantic, CT 06226
Estimated Value: $251,612 - $258,000
3
Beds
1
Bath
960
Sq Ft
$266/Sq Ft
Est. Value
About This Home
This home is located at 29 Spring View Ln, Willimantic, CT 06226 and is currently estimated at $255,403, approximately $266 per square foot. 29 Spring View Ln is a home located in Windham County with nearby schools including Windham Middle School, Windham High School, and St Mary St Joseph School.
Ownership History
Date
Name
Owned For
Owner Type
Purchase Details
Closed on
Oct 31, 2007
Sold by
Sturrino Wilfredo and Sturrino Hilda A
Bought by
Lopez Jase and Lopez Emma
Current Estimated Value
Home Financials for this Owner
Home Financials are based on the most recent Mortgage that was taken out on this home.
Original Mortgage
$162,714
Outstanding Balance
$103,216
Interest Rate
6.43%
Mortgage Type
Purchase Money Mortgage
Estimated Equity
$152,187
Purchase Details
Closed on
Nov 17, 2003
Sold by
Roy Sandra A
Bought by
Iturrino Wilfredo and Iturrino Hilda A
Home Financials for this Owner
Home Financials are based on the most recent Mortgage that was taken out on this home.
Original Mortgage
$126,800
Interest Rate
5.81%
Mortgage Type
Purchase Money Mortgage
Purchase Details
Closed on
Jun 20, 1997
Sold by
Hall Evan
Bought by
Roy Sandra
Purchase Details
Closed on
Jun 19, 1997
Sold by
Mickelson Kenneth and Mickelson Donna
Bought by
Hall Evan
Create a Home Valuation Report for This Property
The Home Valuation Report is an in-depth analysis detailing your home's value as well as a comparison with similar homes in the area
Home Values in the Area
Average Home Value in this Area
Purchase History
| Date | Buyer | Sale Price | Title Company |
|---|---|---|---|
| Lopez Jase | $164,000 | -- | |
| Iturrino Wilfredo | $128,890 | -- | |
| Roy Sandra | $58,000 | -- | |
| Hall Evan | $33,000 | -- |
Source: Public Records
Mortgage History
| Date | Status | Borrower | Loan Amount |
|---|---|---|---|
| Open | Hall Evan | $162,714 | |
| Previous Owner | Hall Evan | $126,800 | |
| Previous Owner | Hall Evan | $4,200 | |
| Previous Owner | Hall Evan | $75,000 |
Source: Public Records
Tax History
| Year | Tax Paid | Tax Assessment Tax Assessment Total Assessment is a certain percentage of the fair market value that is determined by local assessors to be the total taxable value of land and additions on the property. | Land | Improvement |
|---|---|---|---|---|
| 2025 | $4,947 | $133,620 | $28,200 | $105,420 |
| 2024 | $4,952 | $133,620 | $28,200 | $105,420 |
| 2023 | $3,947 | $83,260 | $24,520 | $58,740 |
| 2022 | $3,888 | $83,260 | $24,520 | $58,740 |
| 2021 | $4,170 | $83,260 | $24,520 | $58,740 |
| 2020 | $4,161 | $83,260 | $24,520 | $58,740 |
| 2019 | $4,094 | $83,260 | $24,520 | $58,740 |
| 2017 | $3,372 | $70,820 | $21,750 | $49,070 |
| 2015 | $3,256 | $70,820 | $21,750 | $49,070 |
| 2014 | $3,076 | $70,820 | $21,750 | $49,070 |
Source: Public Records
Map
Nearby Homes
- 37 Spring View Ln
- 23 Spring View Ln
- 17 Spring View Ln
- 45 Spring View Ln
- 22 Spring View Ln
- 241 Southridge Dr
- 36 Spring View Ln
- 18 Spring View Ln
- 49 Spring View Ln
- 253 Southridge Dr
- 247 Southridge Dr
- 48 Spring View Ln
- 12 Spring View Ln
- 235 Southridge Dr
- 263 Southridge Dr
- 362 Mountain St
- 269 Southridge Dr
- 370 Mountain St
- 229 Southridge Dr
Your Personal Tour Guide
Ask me questions while you tour the home.