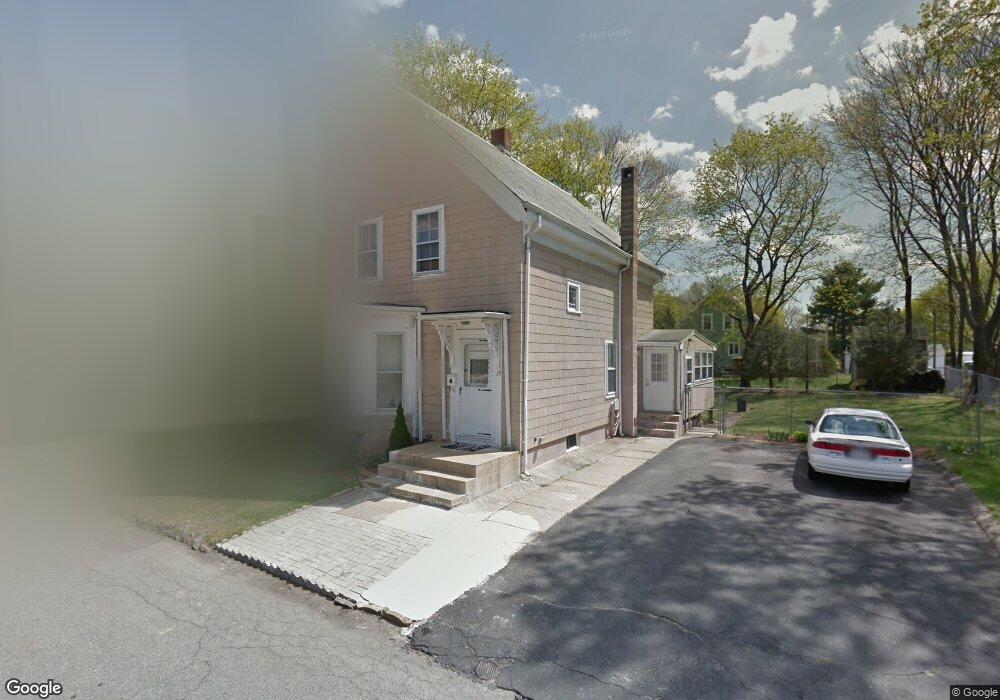
29 Spruce St Brockton, MA 02302
Clifton Heights NeighborhoodEstimated Value: $445,000 - $531,000
3
Beds
2
Baths
1,326
Sq Ft
$376/Sq Ft
Est. Value
About This Home
This home is located at 29 Spruce St, Brockton, MA 02302 and is currently estimated at $498,169, approximately $375 per square foot. 29 Spruce St is a home located in Plymouth County with nearby schools including Davis K-8 School, John F. Kennedy Elementary School, and South Middle School.
Ownership History
Date
Name
Owned For
Owner Type
Purchase Details
Closed on
Aug 3, 1990
Sold by
Kravitz Alan R
Bought by
Timas Claudino G
Current Estimated Value
Home Financials for this Owner
Home Financials are based on the most recent Mortgage that was taken out on this home.
Original Mortgage
$93,350
Interest Rate
10.02%
Mortgage Type
Purchase Money Mortgage
Create a Home Valuation Report for This Property
The Home Valuation Report is an in-depth analysis detailing your home's value as well as a comparison with similar homes in the area
Home Values in the Area
Average Home Value in this Area
Purchase History
| Date | Buyer | Sale Price | Title Company |
|---|---|---|---|
| Timas Claudino G | $111,000 | -- |
Source: Public Records
Mortgage History
| Date | Status | Borrower | Loan Amount |
|---|---|---|---|
| Open | Timas Claudino G | $76,000 | |
| Closed | Timas Claudino G | $86,750 | |
| Closed | Timas Claudino G | $93,350 |
Source: Public Records
Tax History Compared to Growth
Tax History
| Year | Tax Paid | Tax Assessment Tax Assessment Total Assessment is a certain percentage of the fair market value that is determined by local assessors to be the total taxable value of land and additions on the property. | Land | Improvement |
|---|---|---|---|---|
| 2025 | $5,072 | $418,800 | $140,600 | $278,200 |
| 2024 | $4,798 | $399,200 | $140,600 | $258,600 |
| 2023 | $4,335 | $334,000 | $107,100 | $226,900 |
| 2022 | $4,238 | $303,400 | $97,400 | $206,000 |
| 2021 | $3,880 | $267,600 | $81,500 | $186,100 |
| 2020 | $3,678 | $242,800 | $75,700 | $167,100 |
| 2019 | $3,495 | $224,900 | $73,700 | $151,200 |
| 2018 | $3,358 | $209,100 | $73,700 | $135,400 |
| 2017 | $3,177 | $197,300 | $73,700 | $123,600 |
| 2016 | $3,095 | $178,300 | $71,600 | $106,700 |
| 2015 | $2,673 | $147,300 | $71,600 | $75,700 |
| 2014 | $2,781 | $153,400 | $71,600 | $81,800 |
Source: Public Records
Map
Nearby Homes