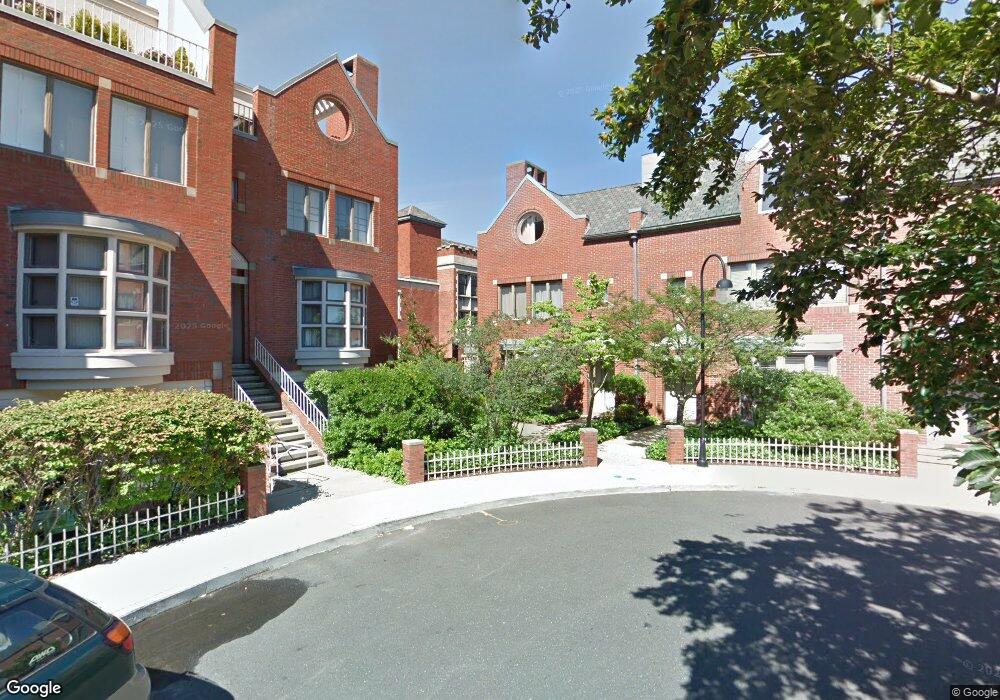
29 Temple Ct Unit C-1 New Haven, CT 06511
Downtown New Haven NeighborhoodEstimated Value: $892,000 - $1,005,131
3
Beds
3
Baths
2,595
Sq Ft
$366/Sq Ft
Est. Value
About This Home
This home is located at 29 Temple Ct Unit C-1, New Haven, CT 06511 and is currently estimated at $948,710, approximately $365 per square foot. 29 Temple Ct Unit C-1 is a home located in New Haven County with nearby schools including East Rock Community Magnet School, Booker T. Washington Academy, and Amistad Academy.
Ownership History
Date
Name
Owned For
Owner Type
Purchase Details
Closed on
May 9, 2022
Sold by
David H Lamoreaux Ret and Lamoreaux
Bought by
Sharifi Mahnoosh and Yaesoubi Reza
Current Estimated Value
Home Financials for this Owner
Home Financials are based on the most recent Mortgage that was taken out on this home.
Original Mortgage
$668,000
Outstanding Balance
$627,540
Interest Rate
4.42%
Mortgage Type
Purchase Money Mortgage
Estimated Equity
$321,170
Purchase Details
Closed on
Sep 15, 2010
Sold by
Lamoreaux David and Lamoreaux Naomi
Bought by
David Lamoreaux Ret
Purchase Details
Closed on
Aug 27, 2009
Sold by
Stansel Tr Doris and New Alliance Bk
Bought by
Lamoreaux Naomi and Lamoreaux David
Home Financials for this Owner
Home Financials are based on the most recent Mortgage that was taken out on this home.
Original Mortgage
$460,500
Interest Rate
5.37%
Mortgage Type
Purchase Money Mortgage
Purchase Details
Closed on
Nov 15, 1995
Sold by
Whiteman Edith D and Whiteman Harold B
Bought by
Stansel Doris A
Home Financials for this Owner
Home Financials are based on the most recent Mortgage that was taken out on this home.
Original Mortgage
$100,000
Interest Rate
7.53%
Mortgage Type
Purchase Money Mortgage
Purchase Details
Closed on
Jun 20, 1989
Sold by
Carley Pearce Resid
Bought by
Whiteman Edith D
Create a Home Valuation Report for This Property
The Home Valuation Report is an in-depth analysis detailing your home's value as well as a comparison with similar homes in the area
Home Values in the Area
Average Home Value in this Area
Purchase History
| Date | Buyer | Sale Price | Title Company |
|---|---|---|---|
| Sharifi Mahnoosh | $835,000 | None Available | |
| David Lamoreaux Ret | -- | -- | |
| Lamoreaux Naomi | $614,000 | -- | |
| Stansel Doris A | $315,000 | -- | |
| Whiteman Edith D | $354,500 | -- |
Source: Public Records
Mortgage History
| Date | Status | Borrower | Loan Amount |
|---|---|---|---|
| Open | Sharifi Mahnoosh | $668,000 | |
| Previous Owner | Whiteman Edith D | $460,500 | |
| Previous Owner | Whiteman Edith D | $50,000 | |
| Previous Owner | Whiteman Edith D | $100,000 | |
| Previous Owner | Whiteman Edith D | $104,000 |
Source: Public Records
Tax History Compared to Growth
Tax History
| Year | Tax Paid | Tax Assessment Tax Assessment Total Assessment is a certain percentage of the fair market value that is determined by local assessors to be the total taxable value of land and additions on the property. | Land | Improvement |
|---|---|---|---|---|
| 2025 | $22,009 | $558,600 | $0 | $558,600 |
| 2024 | $21,506 | $558,600 | $0 | $558,600 |
| 2023 | $20,780 | $558,600 | $0 | $558,600 |
| 2022 | $22,204 | $558,600 | $0 | $558,600 |
| 2021 | $20,423 | $465,430 | $0 | $465,430 |
| 2020 | $20,423 | $465,430 | $0 | $465,430 |
| 2019 | $20,004 | $465,430 | $0 | $465,430 |
| 2018 | $20,004 | $465,430 | $0 | $465,430 |
| 2017 | $18,003 | $465,430 | $0 | $465,430 |
| 2016 | $19,469 | $468,580 | $0 | $468,580 |
| 2015 | $19,469 | $468,580 | $0 | $468,580 |
| 2014 | $19,469 | $468,580 | $0 | $468,580 |
Source: Public Records
Map
Nearby Homes
- 29 Winchester Ave
- 124 Court St Unit 406
- 91 Church St Unit 3
- 91 Church St Unit 2
- 91 Church St Unit 1
- 130 Winchester Ave Unit 103
- 329 Saint John St
- 8 Academy St
- 185 Saint Ronan St
- 614 Chapel St
- 100 York St Unit 6E
- 100 York St Unit 3B
- 100 York St Unit 12s
- 100 York St Unit 9B
- 100 York St Unit 12J
- 295 Ashmun St
- 120 Wooster St Unit V
- 56 Nash St
- 68 Henry St
- 106 Livingston St Unit A1
- 29 Temple Ct
- 27 Temple Ct
- 25 Temple Ct
- 23 Temple Ct
- 23 Temple Ct Unit C-4
- 31 Temple Ct
- 21 Temple Ct
- 33 Temple Ct
- 33 Temple Ct Unit D1
- 19 Temple Ct
- 35 Temple Ct
- 35 Temple Ct Unit 35
- 37 Temple Ct
- 37 Temple Ct Unit D-2
- 17 Temple Ct
- 17 Temple Ct Unit C7
- 39 Temple Ct
- 41 Temple Ct
- 41 Temple Ct Unit 41
- 48 Whitney Ave